Figure 6.
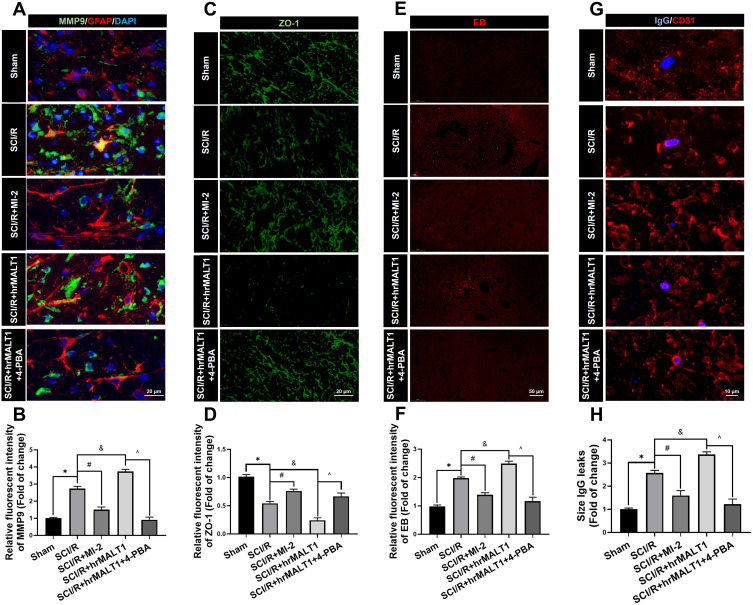
Evaluation of the blood-spinal cord barrier permeability. (A) Double immunofluorescent staining showed the MMP9 expression in astroglia of spinal cord. Scale bar = 20 μm. (B) Immunofluorescent density analysis quantifies the expression of MMP9. (C) Immunofluorescent staining of ZO-1 in the anterior horn of spinal cord in rats. Scale bar = 20μm. (D) Immunofluorescent density analysis quantifies the expression of ZO-1. (E) Evans Blue (EB) dye extravasation (red fluorescence) from the blood vessel in the spinal cord. (F) Immunofluorescent density analysis quantifies the extravasation of EB. n = 5 per group. (G) Representative graphs of blood-spinal cord barrier permeability identified by IgG-positive leakages (blue) outside of the endothelium. Scale bar = 10 µm. (H) Average size calculation based on IgG+ leakages and fold change in different groups. Data are presented as the mean ± SEM. n = 6 per group. *P < 0.05 vs sham group, #P < 0.05 vs SCI/R group, &P < 0.05 vs SCI/R group, ^P < 0.05 vs SCI/R + hrMALT1 group.

