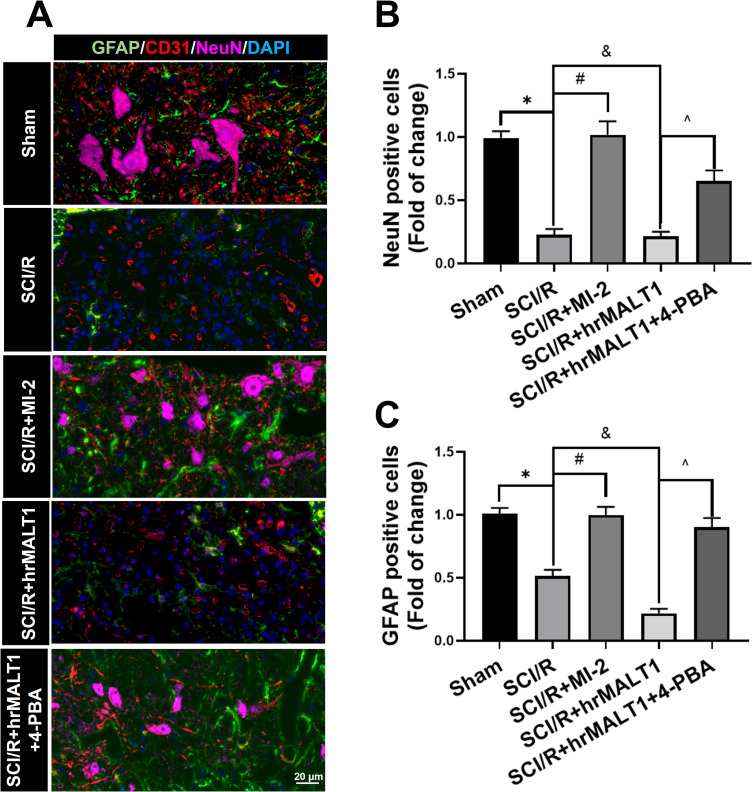
Figure 8.
Evaluation of the neurovascular units in spinal cord. (A) The neurons, astrocytes and endothelial cells co-localization in spinal cord anterior horn were detected by triple immunofluorescent staining. Scale bar = 20 μm. (B, C) The number of NeuN and/or GFAP positivities was quantitatively analyzed. Data are presented as the mean ± SEM. n = 6 per group. *P < 0.05 vs sham group, #P < 0.05 vs SCI/R group, &P < 0.05 vs SCI/R group, ^P < 0.05 vs SCI/R + hrMALT1 group.

