Figure 6.

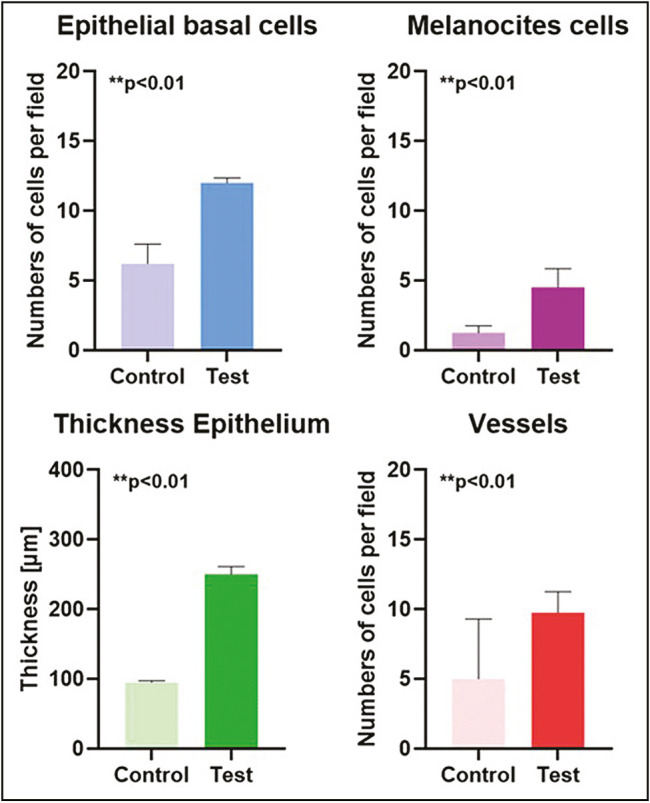
The bar graphs show the epithelial basal cells, epithelial thickness, melanocytes, and vessel number (mean, standard deviation)

The bar graphs show the epithelial basal cells, epithelial thickness, melanocytes, and vessel number (mean, standard deviation)