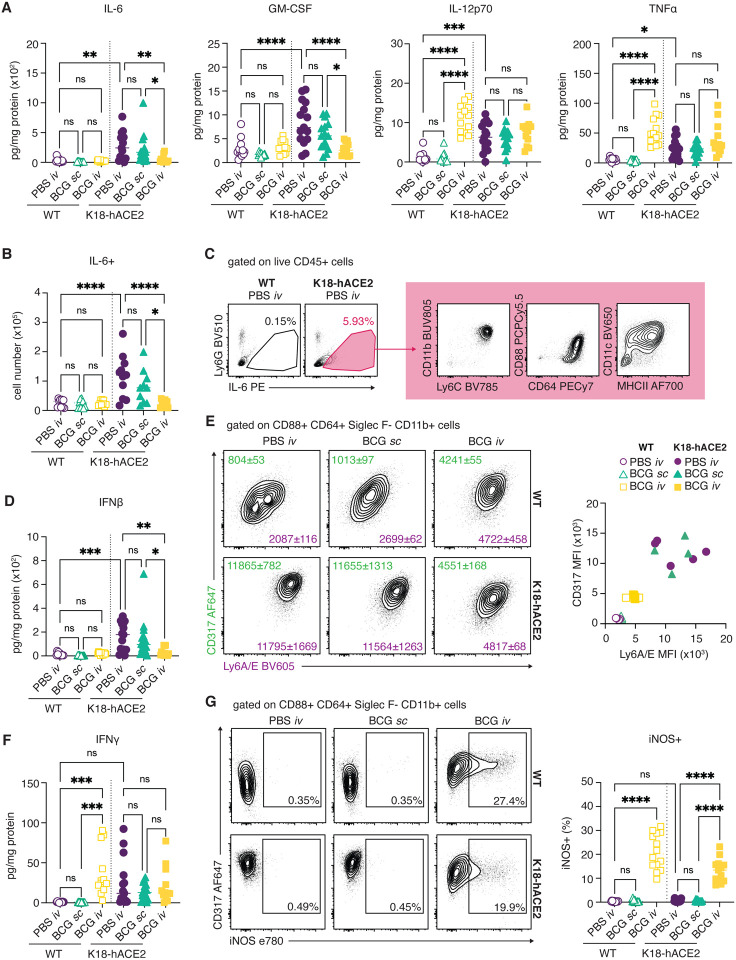
Fig 4: Prior iv BCG inoculation alters the inflammatory cytokine milieu of the lung following SARS-CoV-2 challenge.
(A-G) K18-hACE2 mice or non-transgenic littermate controls (WT) were inoculated with 106 CFU BCG Pasteur by subcutaneous (sc) or intravenous (iv) routes. Control animals received the same volume of PBS iv. At 42 days post BCG administration, mice were infected with 103 TCID50 SARS-CoV-2 (WA1/2020) by intranasal instillation. Lungs were collected 5 days after viral challenge and assessed by flow cytometry and cytokine multiplexing. (A) IL-6, GM-CSF, IL-12p70 and TNFα levels in lung homogenate, standardized to total protein concentration. (B) Number of IL-6+ cells as determined by flow cytometry. (C) Gating of IL-6+ cells from total CD45+ cells and surface marker expression of IL-6+ cells from K18-hACE2 PBS iv animals. Plots show data concatenated from 5 animals and are representative of 2 independent experiments. (D) IFNβ levels in lung homogenate, standardized to total protein concentration. (E) Representative contour plots depict CD317 (green) and Ly6A/E (purple) expression by CD88+ CD64+ Siglec F− CD11b+ macrophages (left). Median fluorescence intensity (MFI) +/− standard error of the mean is indicated on the plots (n=4–5). MFI values for individual animals are shown on the right. (F) IFNγ levels in lung homogenate, standardized to total protein concentration. (G) Representative contour plots depict CD317 and iNOS expression by CD88+ CD64+ Siglec F− CD11b+ macrophages (left). Frequency of iNOS+ macrophages are shown on the right. Statistical significance was assessed by One-Way ANOVA with Tukey post-test. ns p>0.05; *p<0.05; **p<0.01; ***p<0.001, ****p<0.0001. Unless otherwise stated, data are pooled from 3 independent experiments each with 4–5 mice per group.

