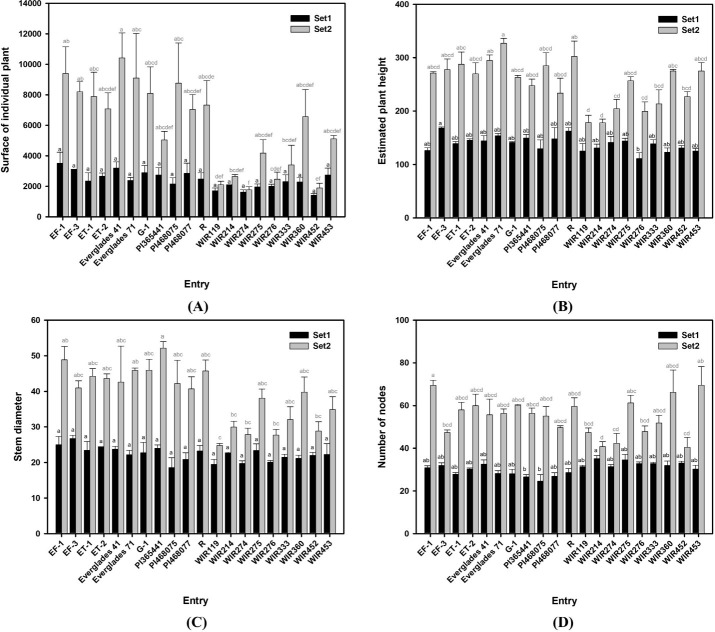
Fig 4. Variation of traits among kenaf (Hibiscus cannabinus L.) entry two growth stage.
(A) Surface of the individual plant (cm2), (B) Expected plant height (mm), (C) Stem diameter (mm), and (D) Number of nodes of 20 kenaf entries at two different growth stages. Set 1 and Set 2 measured June 22 and August 31. The black bar and letter represent set 1, and the grey bar and letter represent set 2. Different letters on the bar are significantly different by Dunn test with Bonferroni adjustment. Non-parametric rank data were used for the statistical analysis; however, untransformed data are represented.

