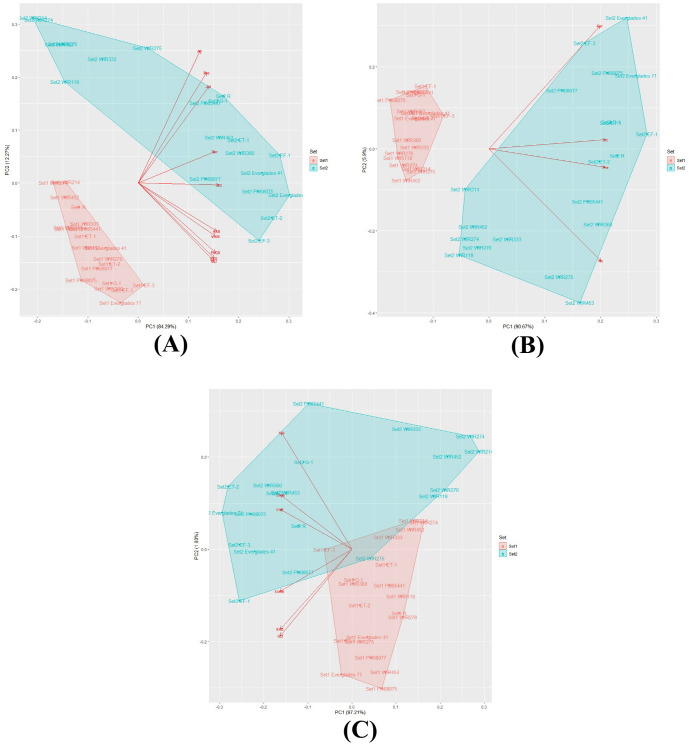
Fig 7. PCA analysis of 20 kenaf entries at two different growth stages.
(A) PCA analysis by surface of individual plant, expected plant height, stem diameter, number of nodes, EXG, EXGR, EXR, GLI, NDI, and VARI; (B) PCA analysis by surface of individual plant, expected plant height, stem diameter, and number of nodes; (C) PCA analysis by EXG, EXGR, EXR, GLI, NDI, and VARI. Set 1, and set 2 measured June 22, and August 31.

