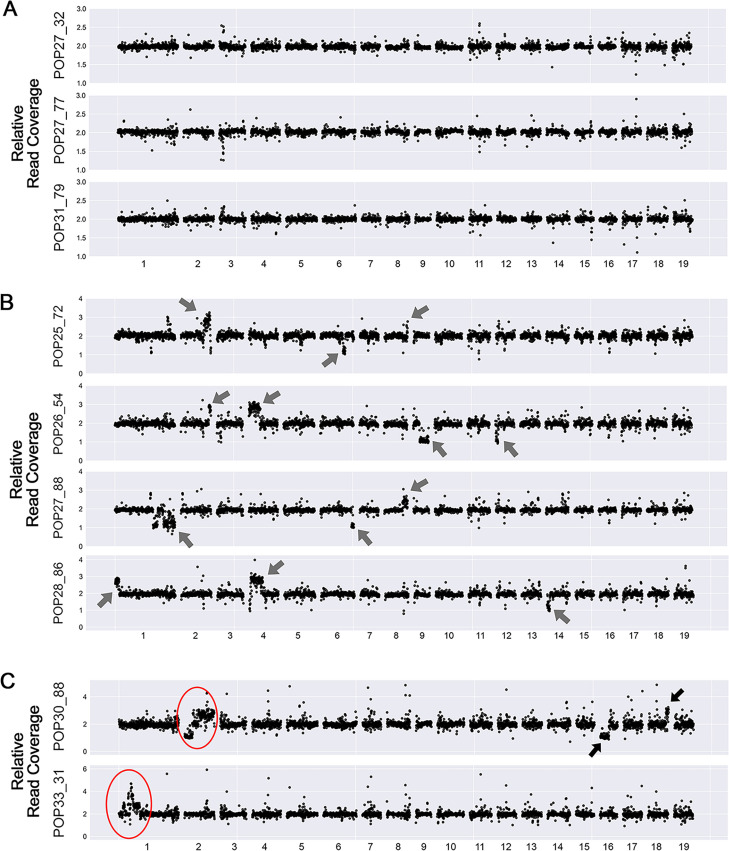
Fig 1. Dosage variation detection.
Dosage variation was detected by displaying relative read coverage. Each data point represents the mean read coverage in non-overlapping 100kb bins, standardized to the mean read depth across all 9 lines. The expected value for a diploid line is a relative read coverage of 2. Values around 1 suggest deletions and values around 3 suggest insertions. (A) Dosage plots for 3 lines exhibiting no obvious instances of dosage variation. (B) Dosage plots for 4 lines containing a small number of indels. The arrows point to the randomly distributed indels identified. (C) Dosage plots for the 2 lines exhibiting shattering patterns. The red circles represent the regions displaying highly clustered copy number variation.

