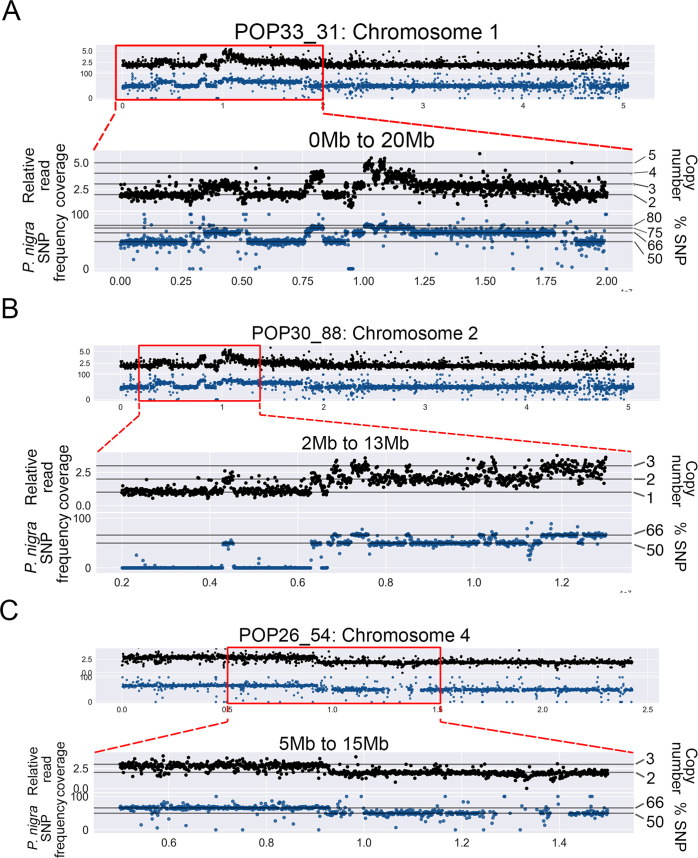
Fig 2. Association of dosage variation patterns with SNP frequency.
To obtain a detailed view of the shattered regions, the genome was divided into narrower bins (10kb bins). Additionally, to confirm the origin of indels, P. nigra (male) SNPs frequencies were calculated for 10kb bins. Black scatterplots: each black dot represents the relative read coverage for a 10kb bin. Blue scatterplots: each blue dot represents the average P. nigra SNP frequency for a 10kb bin. Horizontal lines indicate the expected SNP frequency for different copy number states, as indicated on the right. (A) Chromosome 1 of POP33_3 displayed extremely clustered dosage variation within the first 20Mb, and all variation patterns were associated with P. nigra SNP frequency shifts. (B) Chromosome 2 of POP30_88 displayed extremely clustered dosage variation in the region between 3Mb and 13Mb, and all CNVs were associated with expected P. nigra SNP frequency shifts. (C) One of the large-scale lesions on the POP26_54 genome is shown, providing a comparison between larger randomly distributed indels and the observed shattering patterns in the other two lines.

