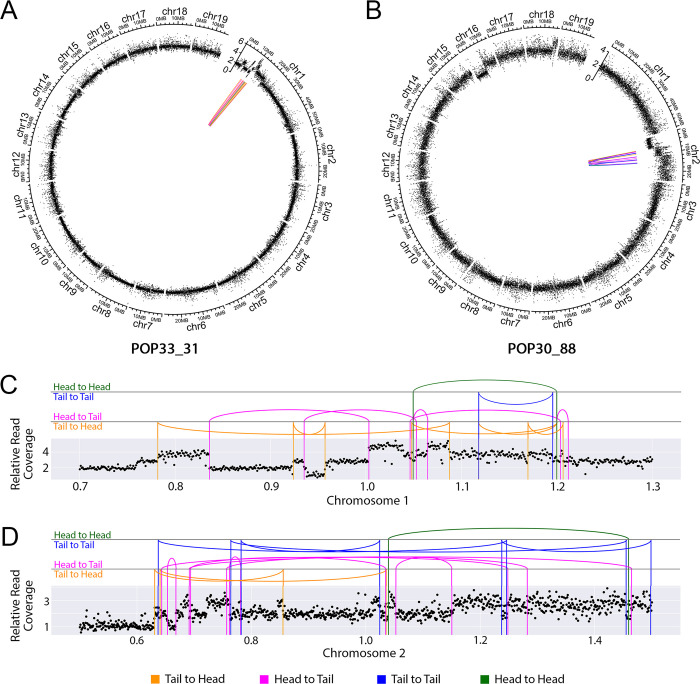
Fig 5. Distribution of the genomic location of the validated DNA junctions.
(A-B) DNA junctions in the two shattered lines (POP33_31 (A) and POP30_88 (B)). The outermost layer displays each chromosome. The next layer displays relative reads coverage, averaged over 10kb non-overlapping bins. In the center, colored lines connect the original genomic locations of each pair of sequences found in novel DNA junctions. (C-D) Close-up view of DNA junctions distribution on the shattered regions of chromosome 1 in POP33_31 (C) and chromosome 2 in POP30_88 (D). The scatter plots show average relative read coverage per 10kb bins, and the colored vertical lines represent exact breakpoints. The arc connecting two vertical lines illustrate the novel junctions connecting vertical lines that represent the breakpoints. All panels: Magenta and orange lines represent sequences that connect in the same direction (Head to Tail in magenta and Tail to Head in orange). Blue and green lines represent sequences that connect in opposite directions (Tail to Tail in blue and Head to Head in green).

