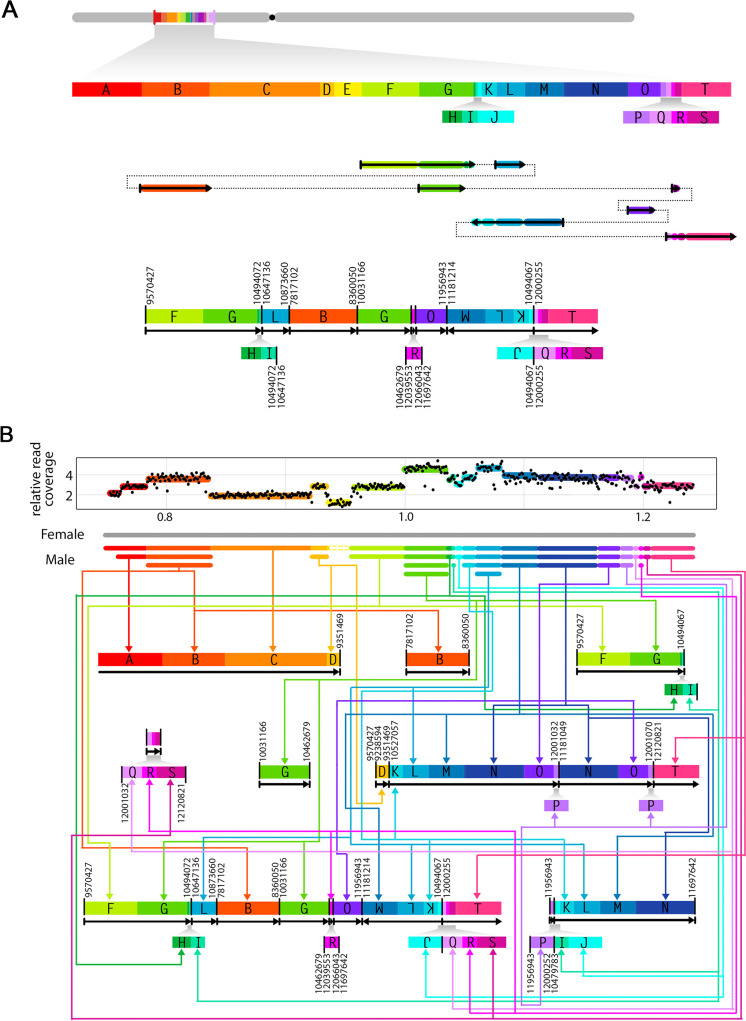
Fig 6. Unraveling the structure of the shattered chromosomes.
Schematic diagrams illustrating the breakpoints rearrangement in one of the genome shattered lines (POP33_31). (A) The reference chromosome 1 is shown in grey and the regions engaged in rearrangement are labeled in alphabetical order. Each labeled block has a unique color and represents a genomic fragment with validated breakpoints on its flanking ends. The small blocks are enlarged below. All block sizes are proportional to genomic coordinates. In the middle is the potential junctions creating one of the rearranged fragments. Solid arrows with colors represent the corresponding blocks, and the dashed lines illustrate the order of blocks reconstruction. At the bottom is the new structure of that same fragment. Novel junctions are highlighted with bold vertical lines, and are labeled with their original genomic positions on two sides. Black arrows below blocks indicate the orientation of reconstructed fragments. Small blocks are enlarged below proportionally. Fragment duplications are linked and pointed out with the same color. (B) Summary of the fragments reconstructed based on the data obtained from line POP33_31. The dosage plot on top displays relative read coverage of the shattering region in chromosome 1. Each DNA block is labeled with the same color used in (A). A schematic representation of chromosome is shown below the dosage plot, with female (P. deltoides, WT) inherited chromosome colored in grey, and male (P. nigra, pollen irradiated) inherited chromosome illustrated in their corresponded colors and copy number states. For each DNA block, the same color arrows guide to the corresponding fragments on the reconstructed chromosome pieces.

