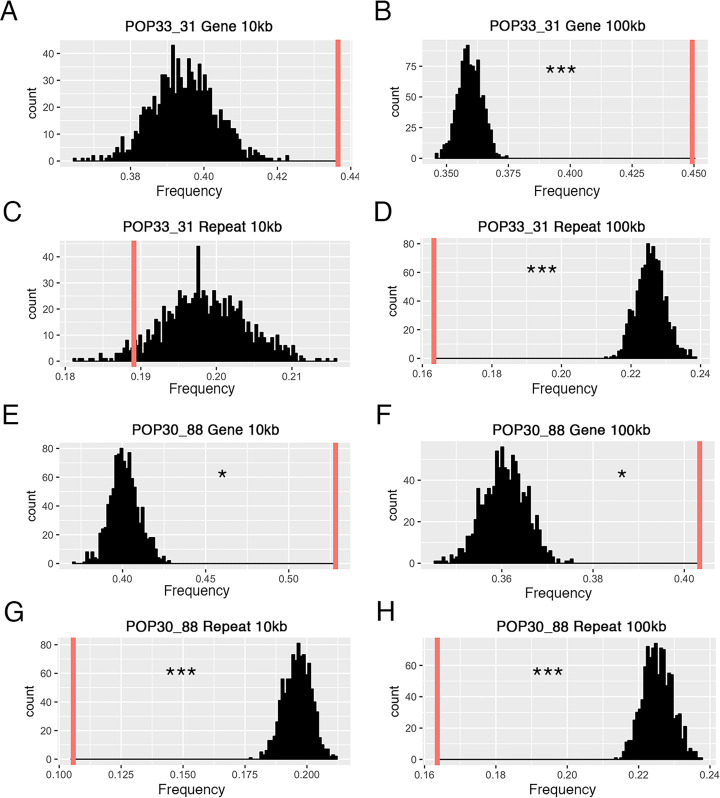
Fig 7. Sequence context surrounding the breakpoints of novel DNA junctions.
The frequency of genes and repeated elements surrounding novel junctions is compared to the corresponding frequencies in randomly selected pseudo junctions. For each panel: 1,000 pseudo-junction were selected at random and the mean percentage of gene or TE space in these 1,000 junctions was calculated. This process was repeated 1,000 times and the distribution of these means are represented in black. The red vertical line represents the mean of enriched frequency for the observed validated novel junctions. Breakpoints of novel junctions in POP33_31 (A-D) occur significantly in gene-rich, repeats-deficient regions under 100kb window size (p-value < 0.001), but do not show statistical significance in 10kb window size. Results were similar for POP30_88 (E-H). The observed junctions are significantly enriched with genes (p-value < 0.05), and have the lack of repeated elements (p-value < 0.001) regardless of window size.

