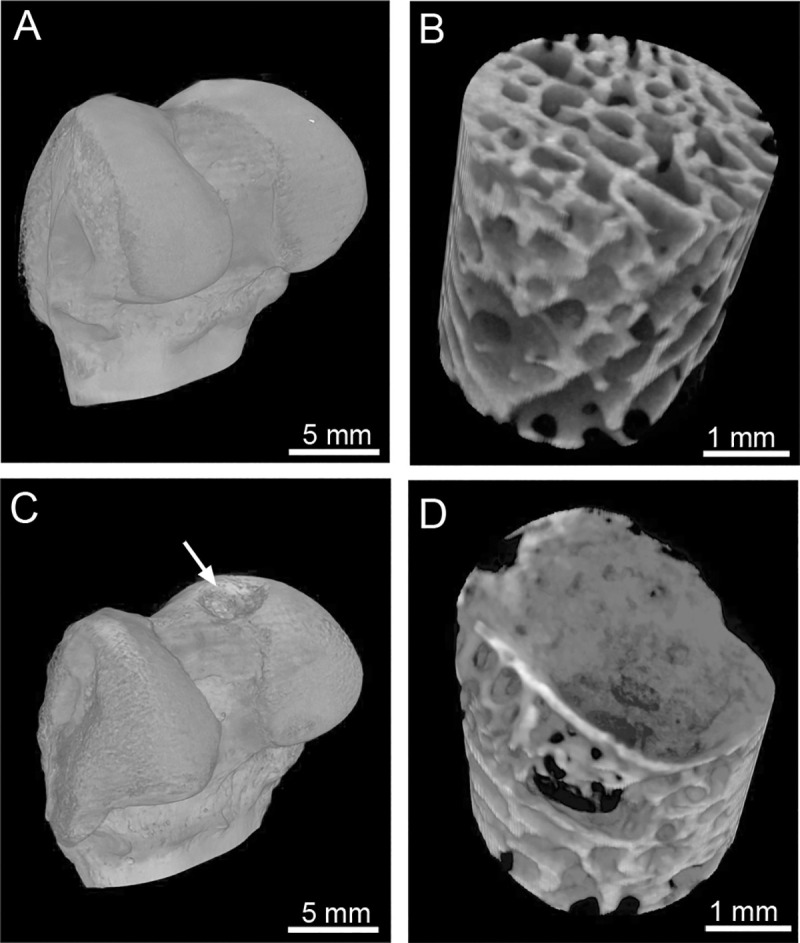
Fig 1.

Representative computer tomography images of the uninjured (A) and injured (C, arrow) bones. Panels B (uninjured bone) and D (injured bone) indicate subchondral bone regions analyzed here to determine the extent of mineralization in the injured area (C&D).
