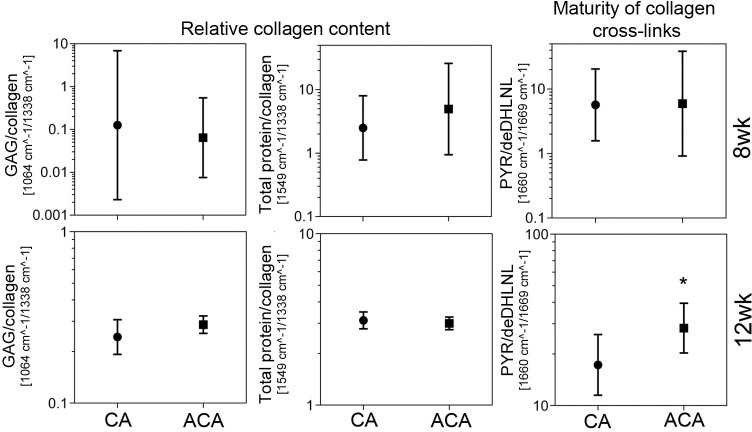
Fig 7. A graphic representation of the FTIR-based assays of the relative amount of collagen and the maturity of collagen cross-links in the scar tissue formed in the OCDs of the CA-treated and the ACA-treated rabbits.
Results for the 8wk and the 12wk groups are presented. The graphs present GMs with 95% confidence intervals. Asterisks indicate groups with statistically significant differences of means. The graph shows the relative collagen content calculated as the GAG/collagen and the total protein/collagen ratios. Hence, the smaller the ratios, the higher relative collagen content. The ratios were calculated based on the areas of the spectral peak corresponding to the sulphated GAGs (centered around 1064 cm-1) and the spectral peak corresponding to collagen (centered around 1338 cm-1). To corroborate these measurements, the relative amount of collagen was also calculated based on the ratios of the spectral peak corresponding to the total proteins, represented by the amide II peak (centered around 1549 cm-1) and the spectral peak corresponding to collagen. The maturity of collagen cross-links was expressed as the ratio of the area of the spectral peak corresponding to the mature trivalent PYR cross-link (centered around 1660 cm-1) and immature divalent deDHLNL cross-link (centered around 1690 cm-1). Thus, the higher the PYR/deDHLNL ratio, the more mature the collagen cross-links. See also S1 Table in S1 File.

