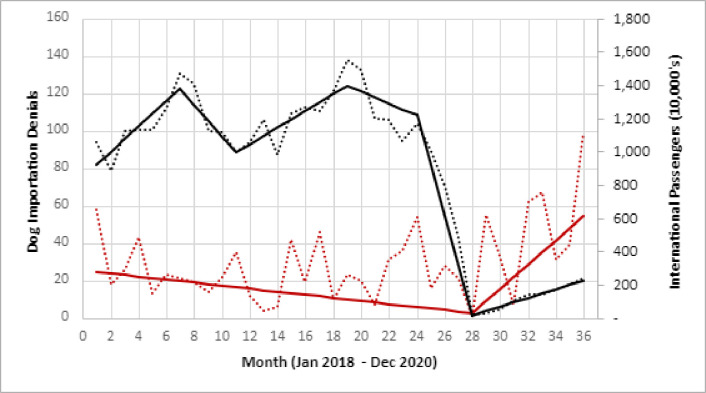
Fig 2. Trends in the number of dogs denied entry and number of travelers arriving into the United States, 2018–2020*†.
* Black dotted line reflects the monthly number of travelers arriving in the United States. The solid line represents the modeled values from trend analysis. † Red dotted line reflects the monthly denial of dogs at CDC quarantine stations. The solid red line represents the modeled values from trend analysis and show two trend periods (January 2018 –April 2020) and (April 2020 –December 2020).

