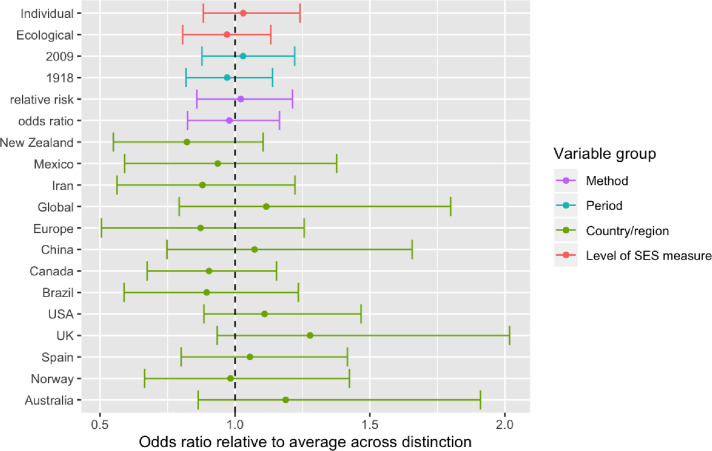
Fig 4. Differences across study level covariates.
The plot shows average estimates and 95% credibility intervals for different study level covariates. The parameters are constrained to sum to zero within each category (e.g., for each draw from the posterior distribution, the sum of country parameters will sum to zero, as will the sum of the period parameters, etc.) See S2 File for model details.

