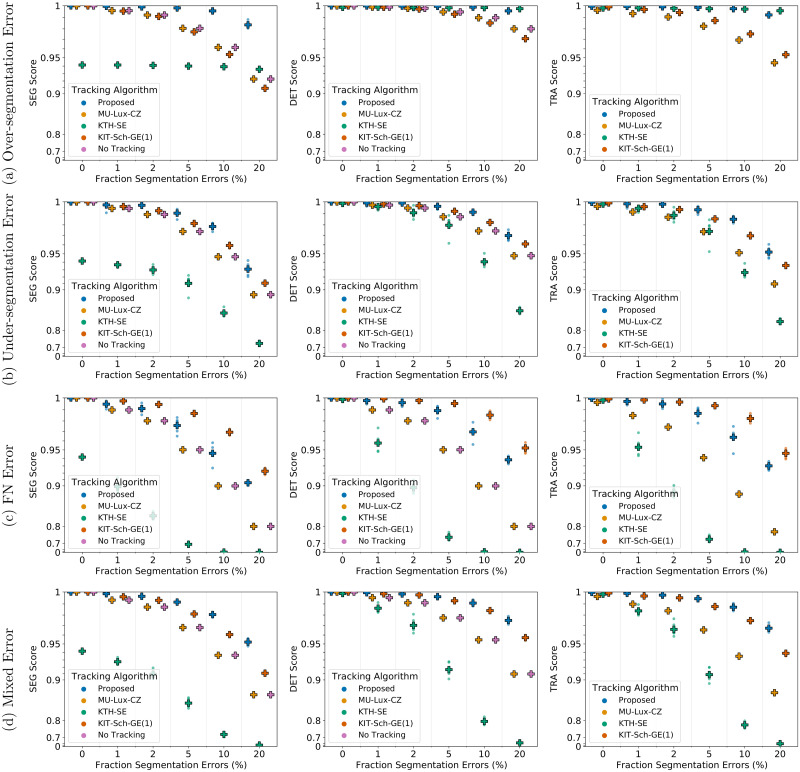
Fig 9. Comparing tracking algorithms on Fluo-N3DH-SIM+ 01.
Shown are the CTC measure scores DET, SEG, and TRA of tracking algorithms on 3D data set Fluo-N2DH-SIM+ 01 when provided with the same erroneous segmentation data. Scores of a single run are shown as circles, while + shows a CTC measure score averaged over N = 5 runs.

