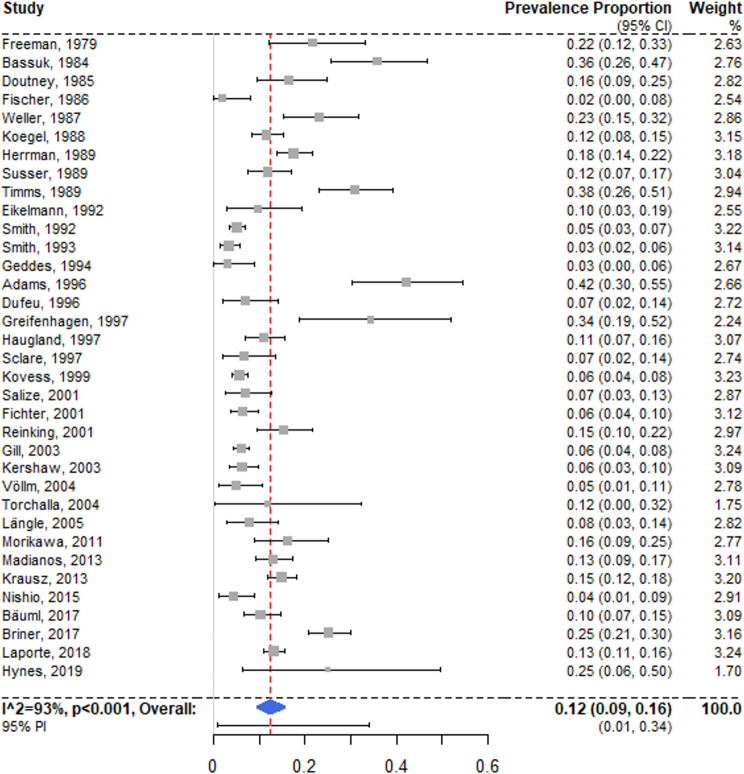
Fig 3. Forest plot of prevalence estimates of schizophrenia spectrum disorders.
Analytic weights are from random effects meta-analysis. Grey boxes represent study estimates; their size is proportional to the respective analytical weight. Lines through the boxes represent the 95% CIs around the study estimates. The blue diamond represents the mean estimate and its 95% CI. The vertical red dashed line indicates the mean estimate. CI, confidence interval; PI, prediction interval; RE, random effects.

