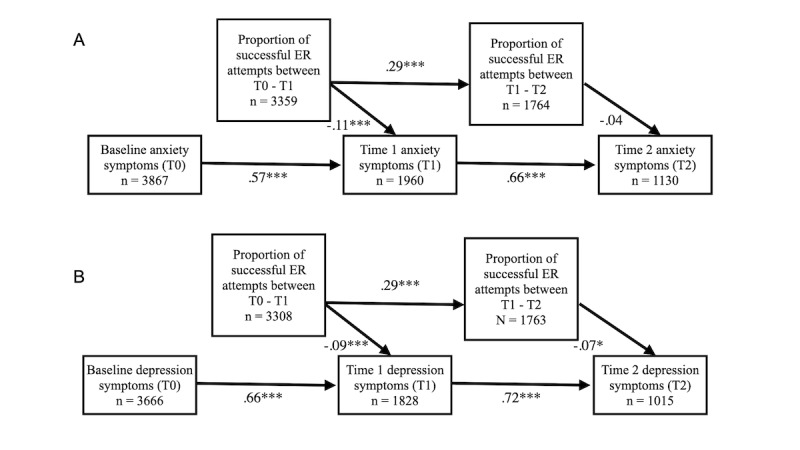
Figure 3.

Path analysis diagram with standardized coefficients. This diagram shows the autoregressive and lagged relationships between the proportion of a user’s ER attempts that were successful out of their total regulation attempts and subsequent anxiety symptoms (A) or depression symptoms (B). ER: emotion regulation. ***P<.001, **P<.01, *P<.05. Exact P values are noted in the text.
