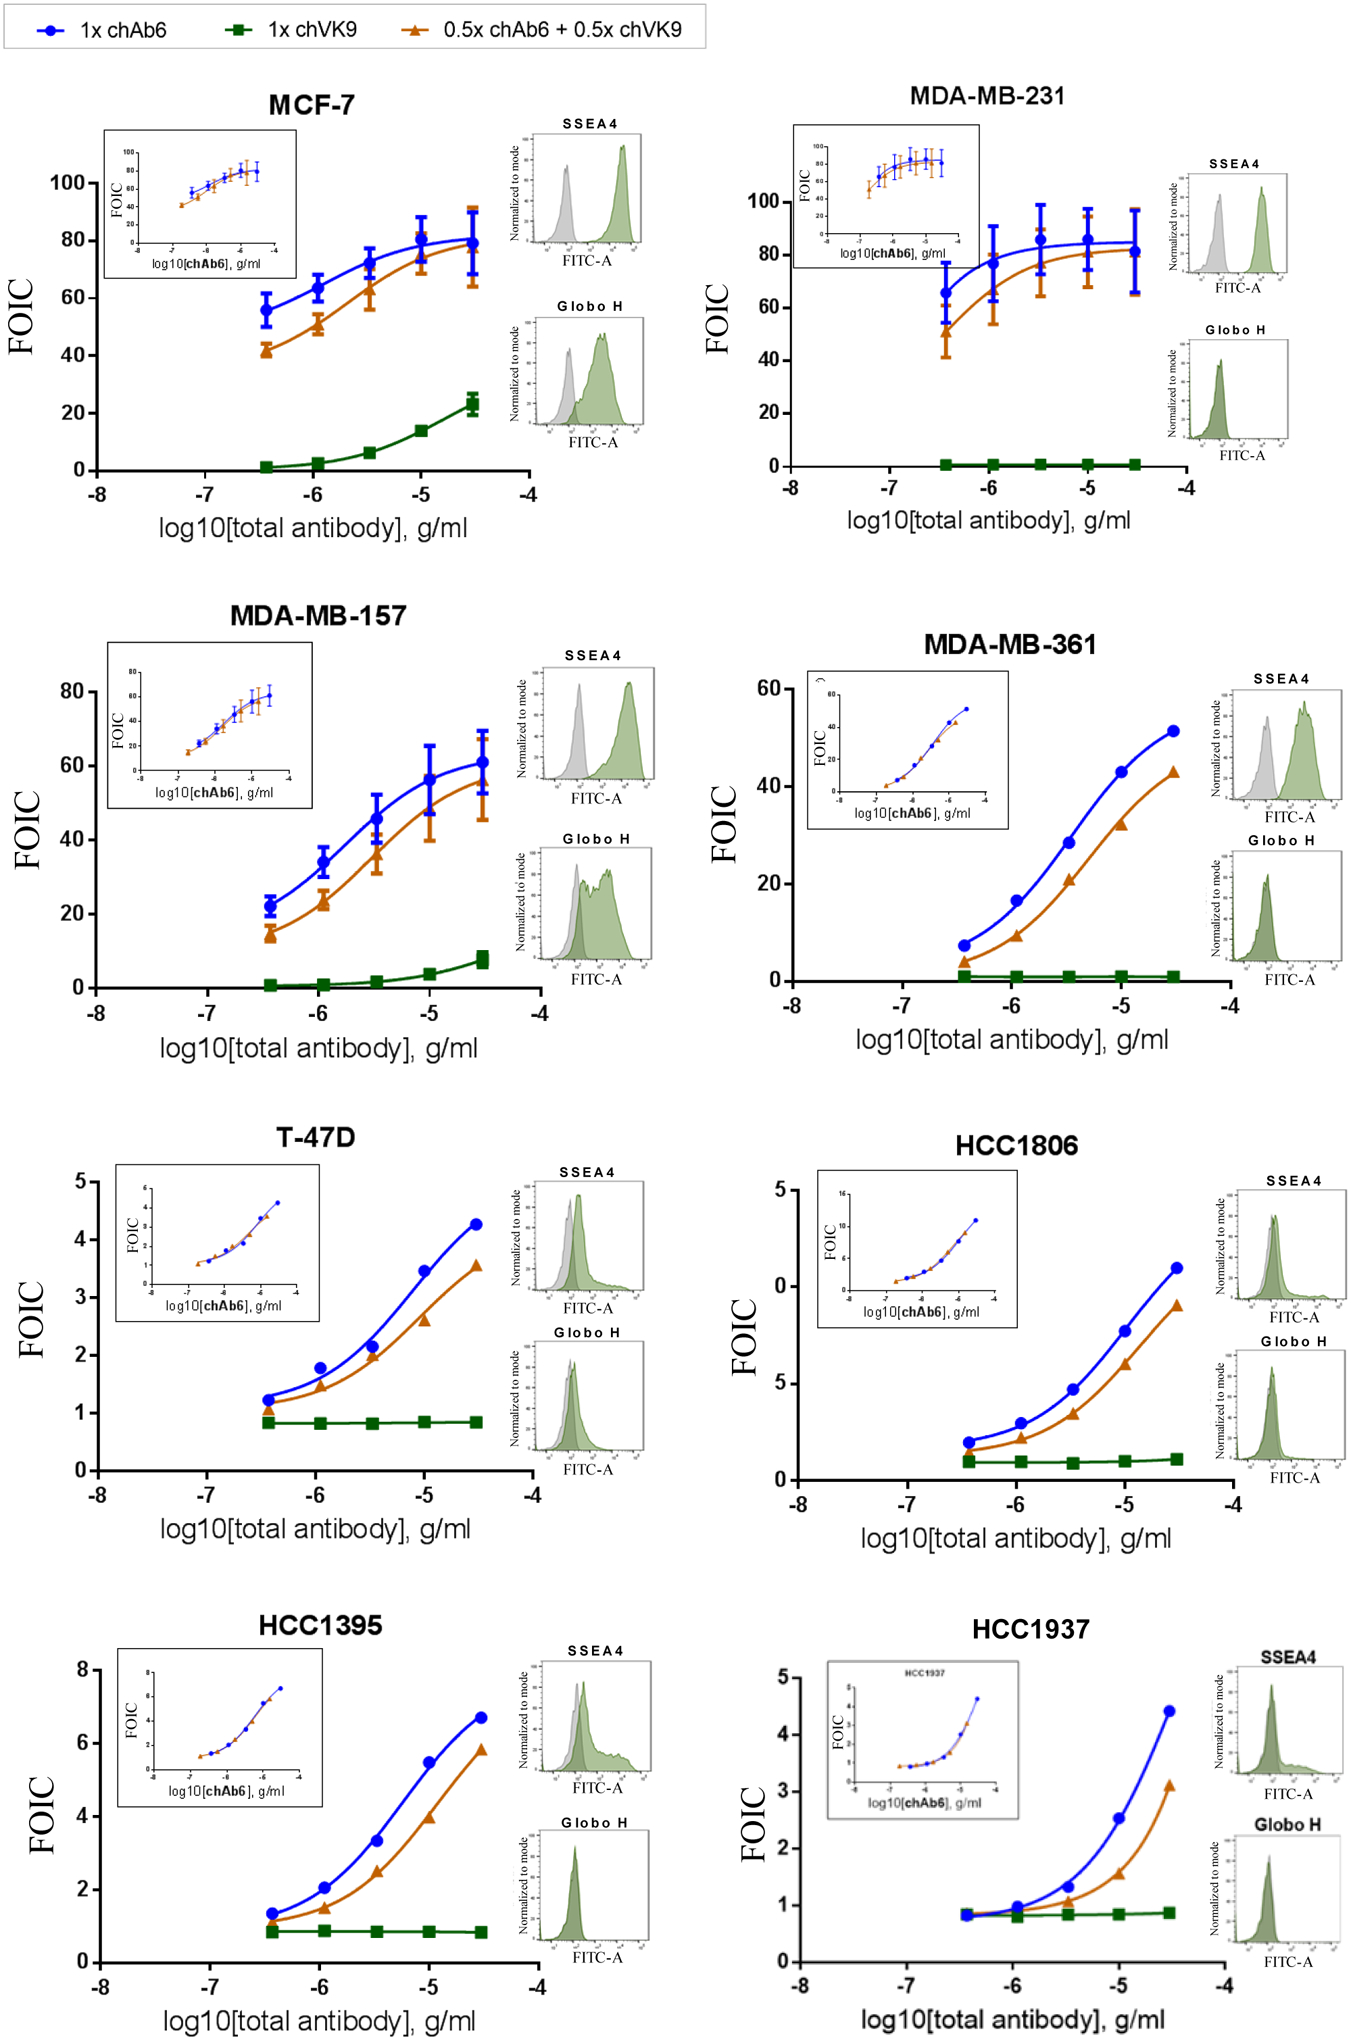
Figure 5.

Combined effect of chAb6 and chVK9 in ADCC assay on various breast cancer cell lines. In combination, half the amount of each antibody was added. The results showed that chAb6 induced most of ADCC response in combination, whereas chVK9 induced very little. For y-axis, FOIC stands for fold of induction (test/calibrator): Fold of induction (calculated as described in Methods) is divided by a common calibrator, in which 0.183 ng/ml Rituximab and WIL2-S (target cell) were used to compare between different cell lines. In the main graphs, FOIC was plotted against total antibody concentration. The inset graphs were generated by changing x-axis to chAb6 concentration. Surface staining was performed by indirect method using 10 μg/ml unconjugated chAb6 or chVK9. The raw data are provided in Table S2.
