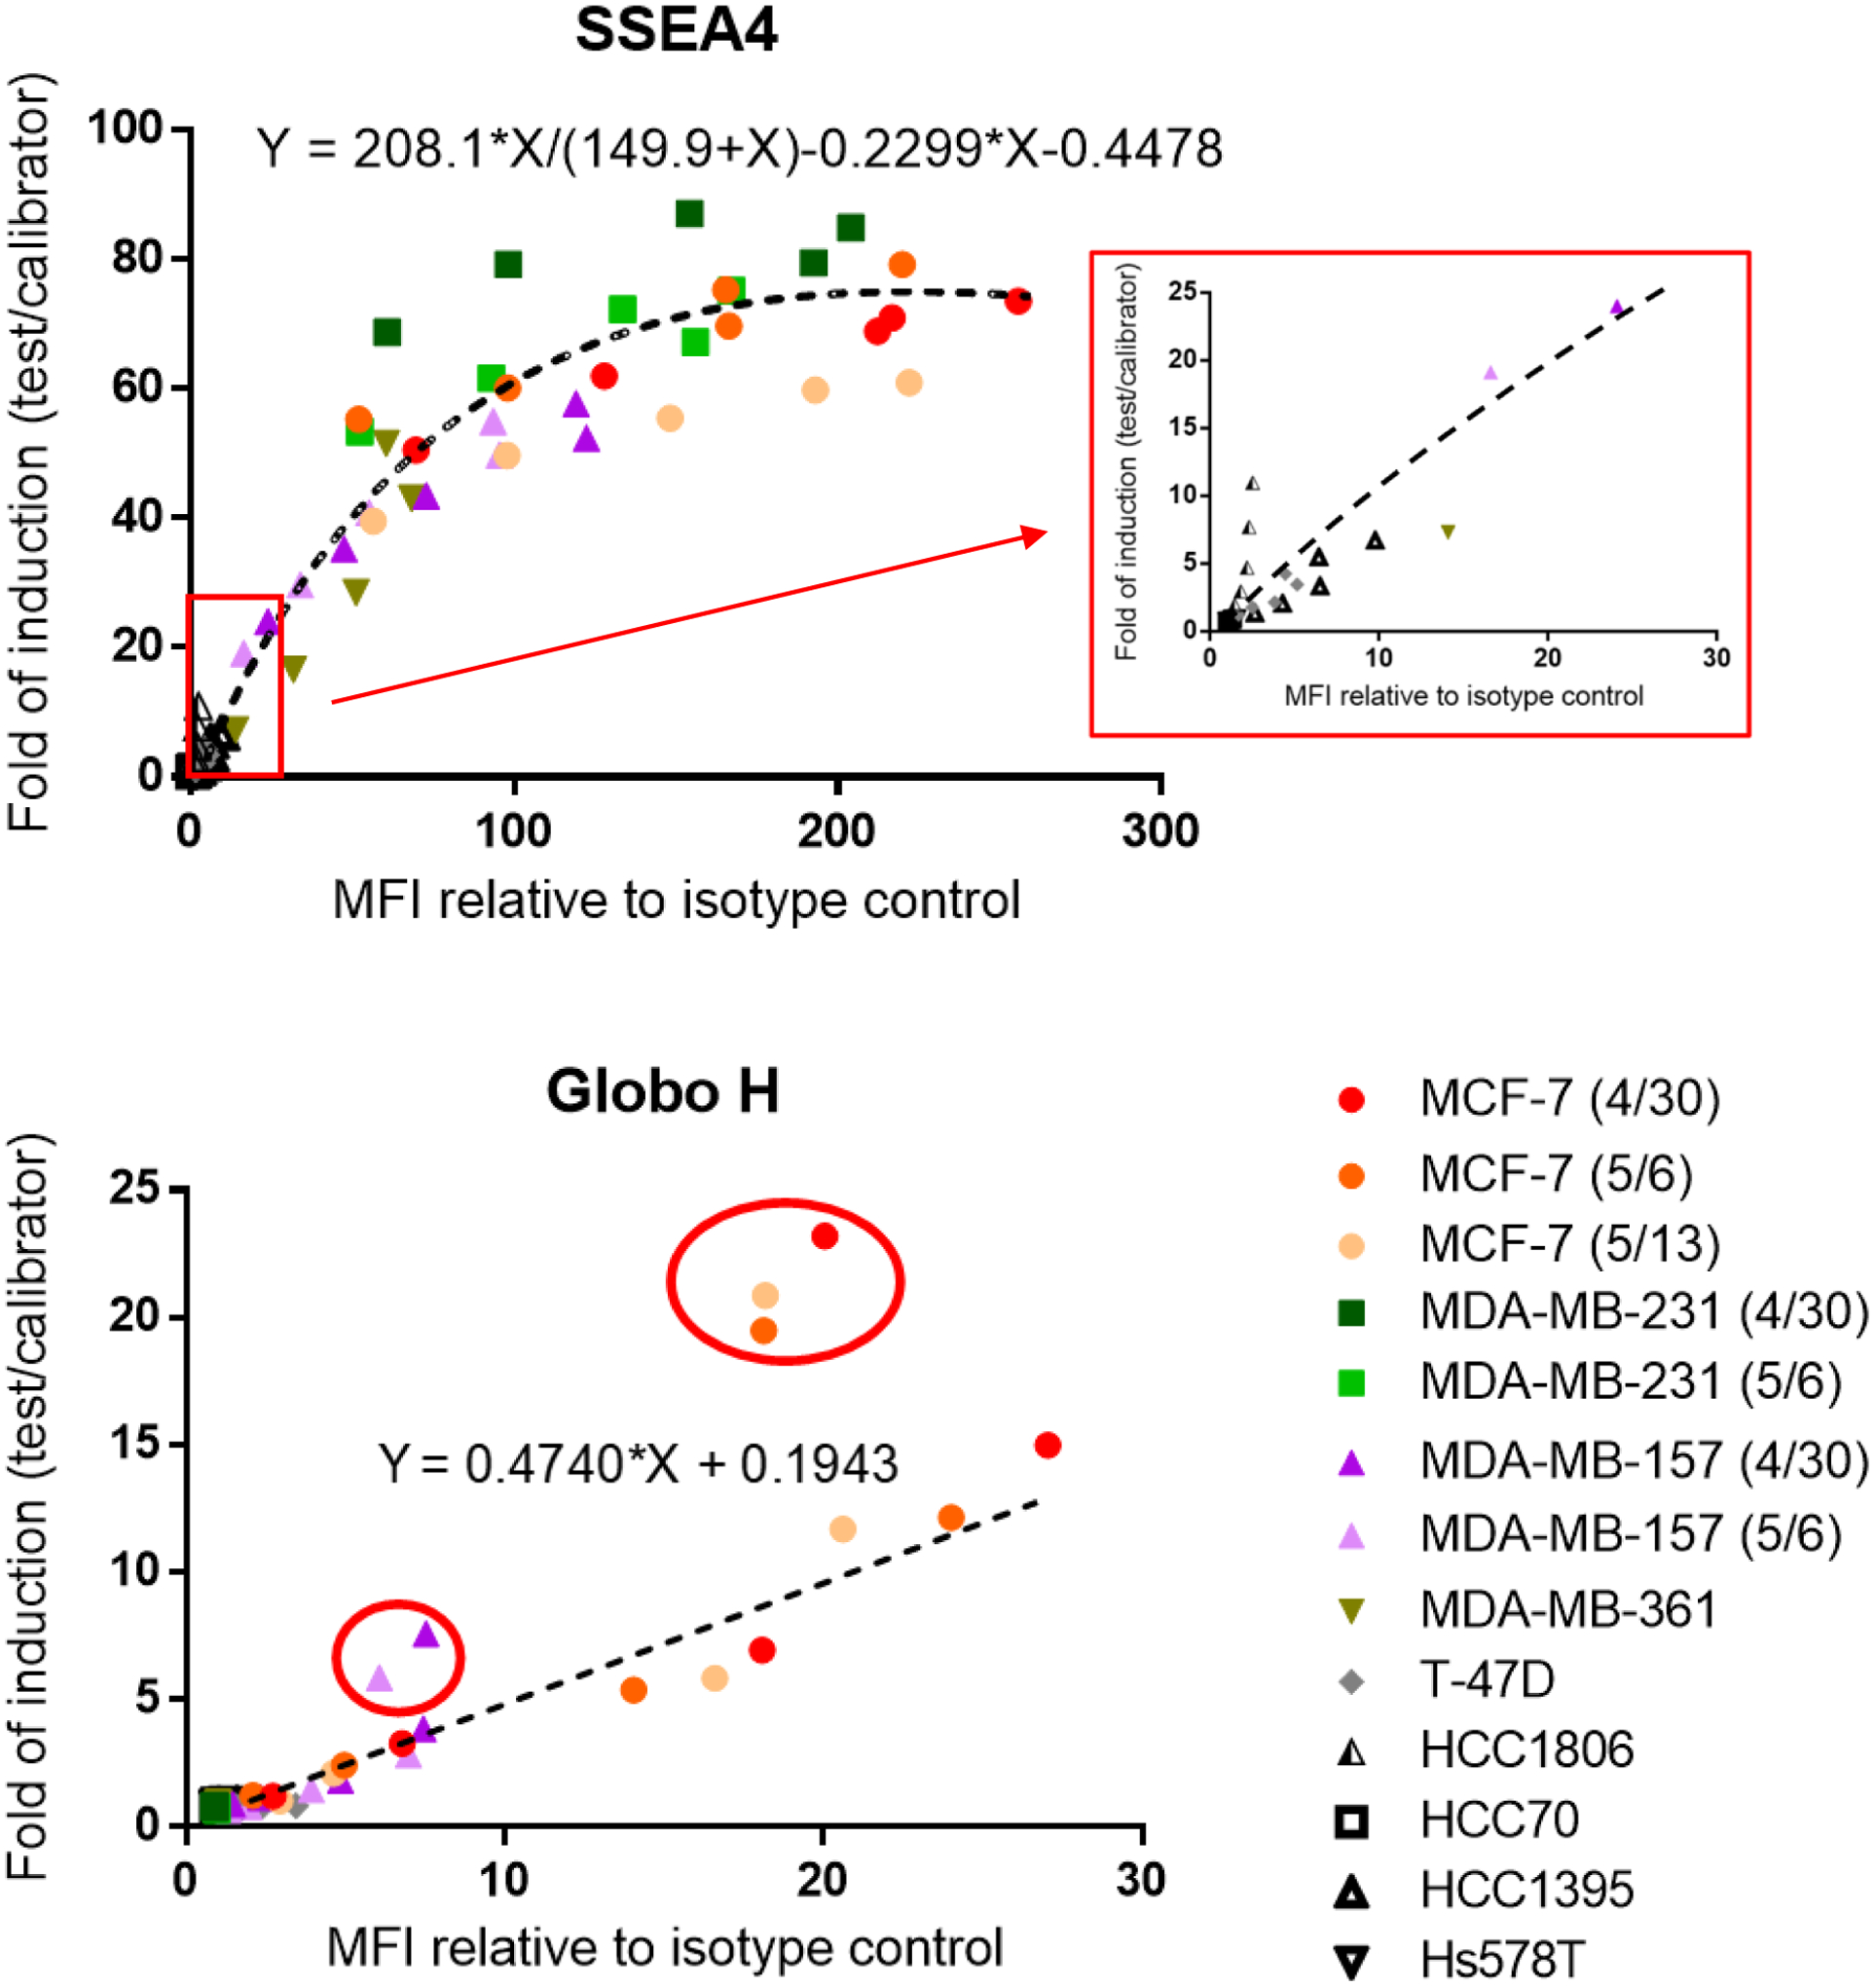
Figure 6.

Correlation of staining signal with ADCC response on various breast cancer cell lines. SSEA4 and Globo H showed positive correlation between staining signal and ADCC response. Surface staining was performed by indirect method. Each point correlates one MFI relative to isotype control with one-fold of induction for a single antibody concentration. Each symbol represents a breast cancer cell line, and different colors in each symbol represent independent experiments. A zoomed-in SSEA4 dot plot (in red box) is shown to compare with Globo H dot plot. Best–fit line or curve was generated using GraphPad Prism 6 software. Points circled in red are indicated as outliers of the best-fit line, and for these points 30 μg/ml chVK9 was used. The raw data are provided in Table S3.
