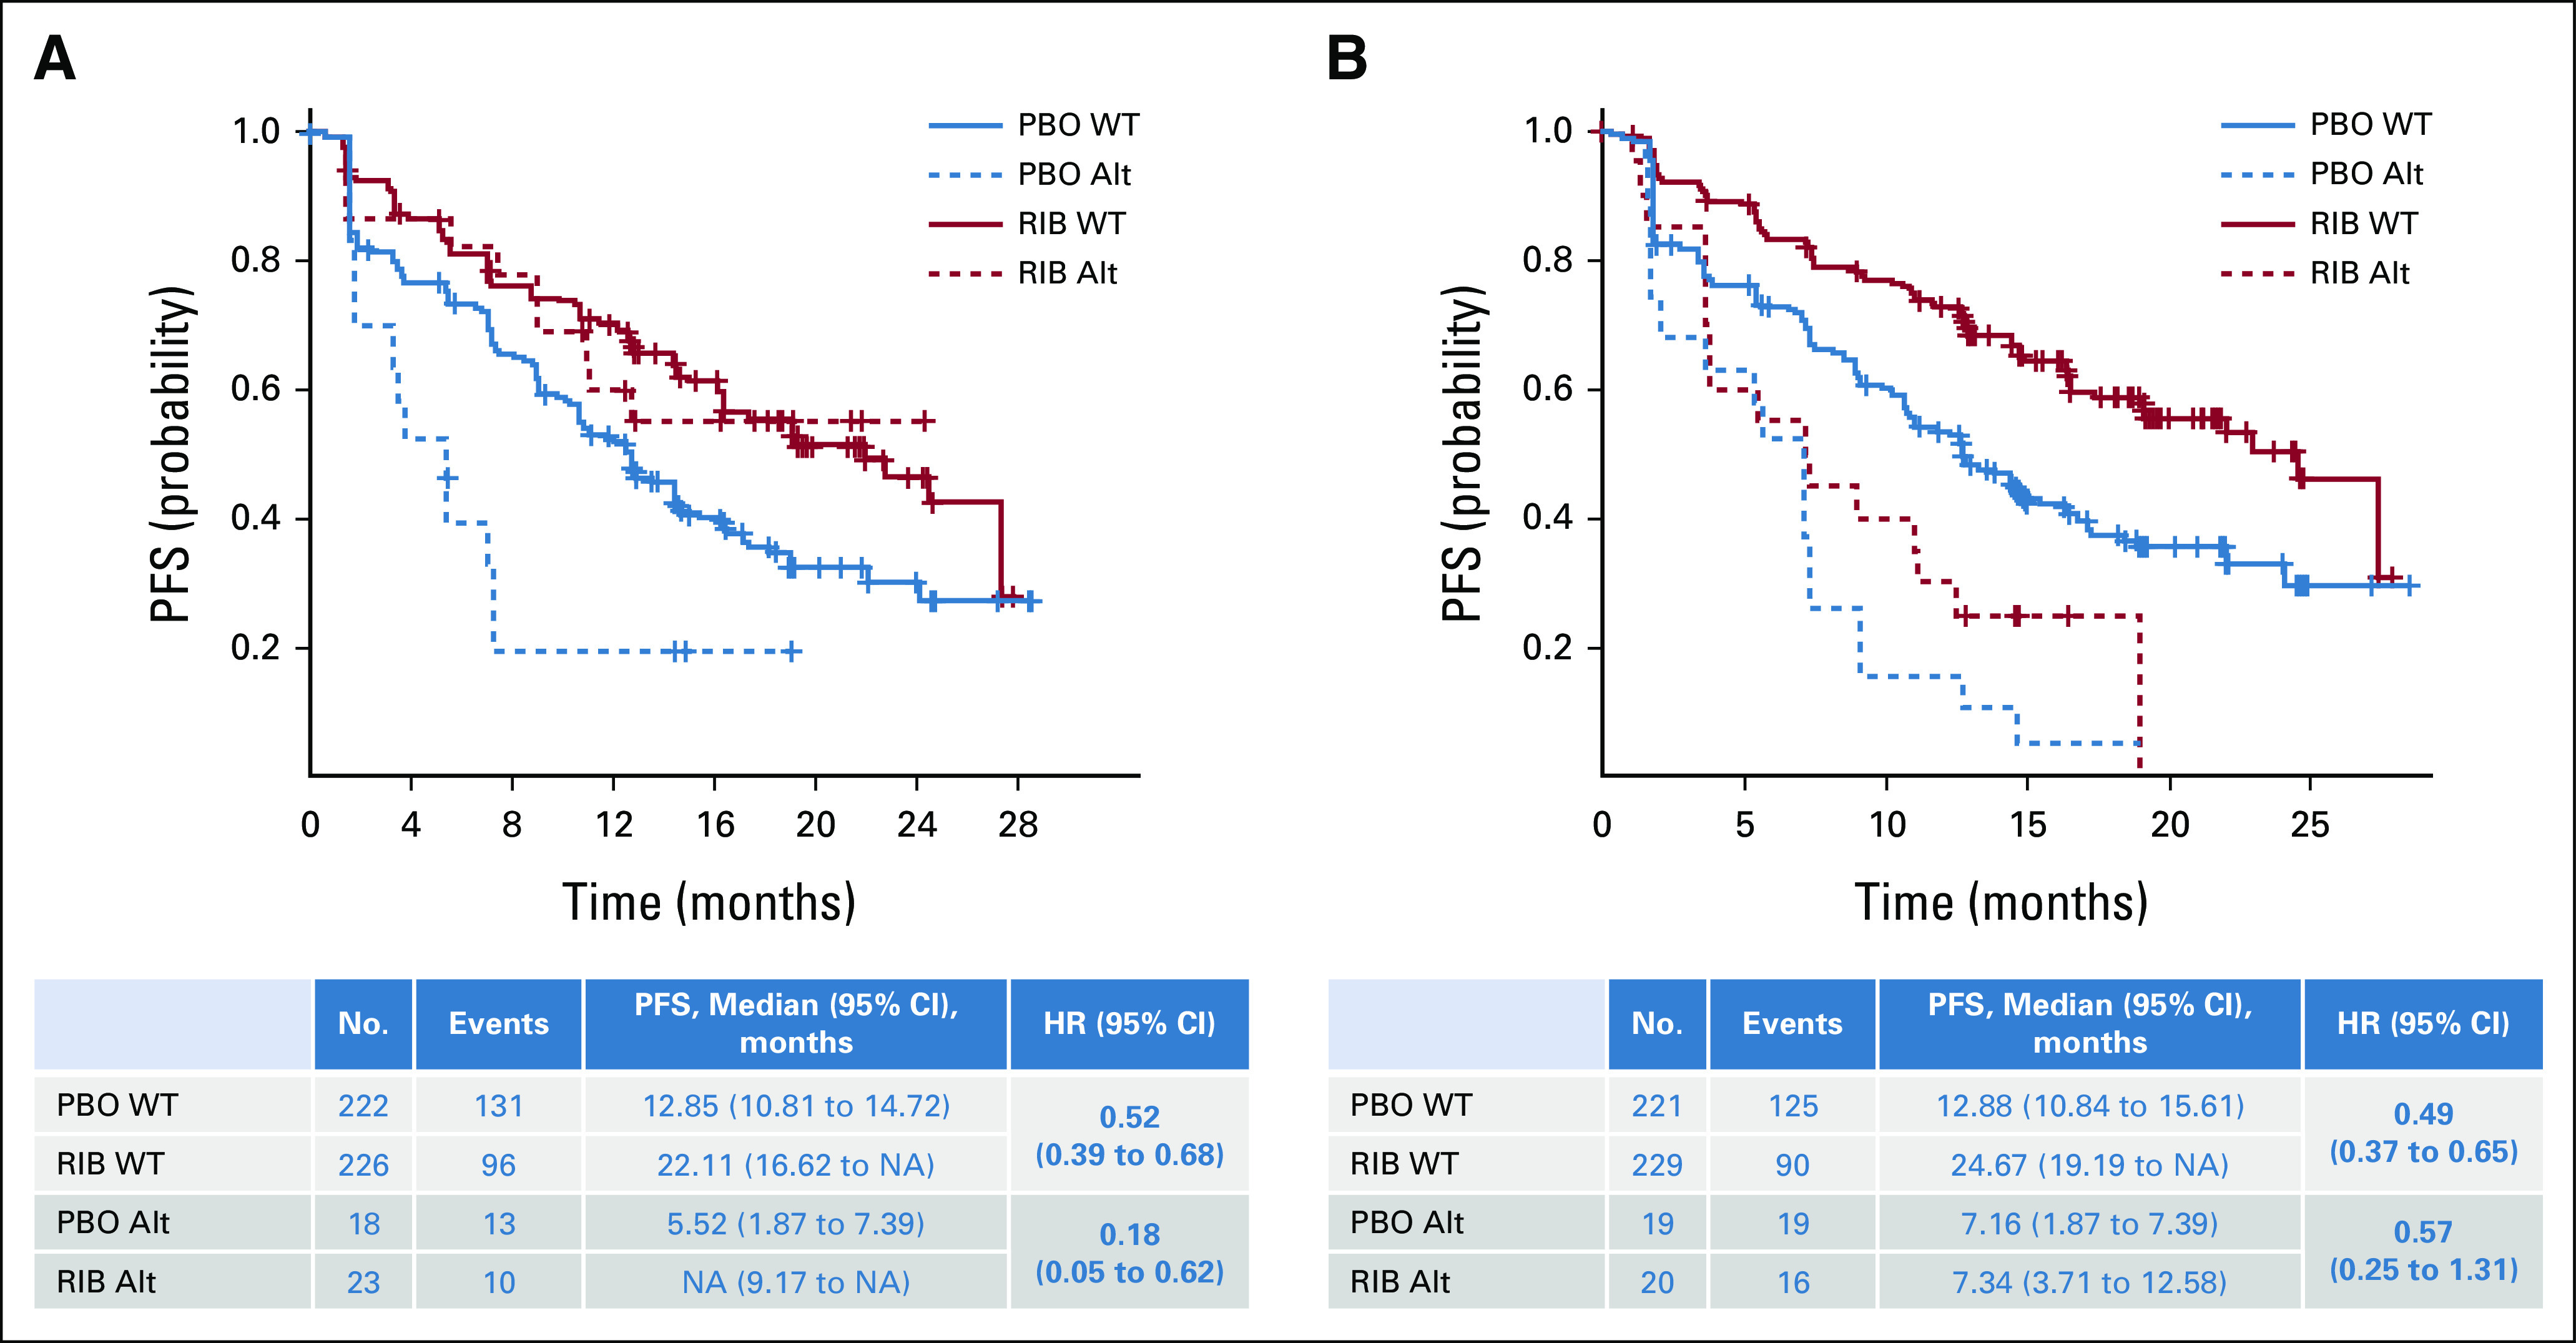
FIG 5.

Association of PFS with genes relevant to the estrogen receptor pathway: (A) PFS by GATA3 alteration status and (B) PFS by MYC alteration status. Kaplan-Meier curves of PFS in patients who exhibited alterations in the indicated genes in circulating tumor DNA. PFS in patients in the ribociclib treatment arm is shown in red; in patients in the placebo treatment arm, it is shown in blue. The WT subgroup is indicated by a solid line, and the alteration subgroup is indicated by a dashed line. HR (95% CI) estimates and median PFS (95% CI) values are shown in the corresponding tables. Alt, altered; HR, hazard ratio; NA, not achieved; PBO, placebo; PFS, progression-free survival; RIB, ribociclib; WT, wild-type.
