. 2021 Sep 7;10:e62394. doi: 10.7554/eLife.62394

Figure 2. ACLY inhibition induces the reprogramming in fatty acid metabolism during iTreg differentiation.

(A) ATP-citrate lyase (ACLY) inhibition reduces de novo fatty acid synthesis (FAS). Naive CD4+ T cells were treated with SB204990 (100 μM) and cultured under inducible regulatory T (iTreg)-polarization condition as in Figure 1E for 24 hr in the presence of [U-13C] glucose (11 mM). Cells were collected and subjected to metabolic flux analysis for FAS by ultra-high performance liquid chromatography-high resolution mass spectrometry (UHPLC-HRMS) analysis. n = 4, Student's t-test, mean ± SD. *p<0.05, **p<0.01, ****p<0.0001; ns, nonsignificant. (B, C) Functional evaluation of metabolic intermediates from FAS on iTreg differentiation. Naive CD4+ T cells were treated with SB204990 (100 μM) and cultured as in Figure 1E in the presence of different doses of palmitate (B) or malonyl-CoA (C). CD4+CD25+Foxp3+ iTreg cells were assayed by flow cytometry (FCM) (left) and quantified (right). (D, E) ACLY inhibition increases carnitine palmitoyltransferase 1 (CPT1) activity and fatty acid oxidation (FAO). In the presence of malonyl-CoA (50 μM) or cerulenin (4 μM), naive CD4+ T cells treated with SB204990 were cultured as in Figure 1E for 24 hr. Cell lysates were used for analyzing CPT1 activity (D). For oxygen consumption rate (OCR) detection, cells were transferred to XF Base Medium containing palmitate and carnitine. Diagram (left) illustrating the OCR at various conditions and associated quantifications (right) are shown (E). (F) Impact of Cpt1 knockdown on iTreg differentiation. Naive CD4+ T cells transfected with small interfering RNA (siRNA) against Cpt1 were cultured as in Figure 1E. CD4+CD25+Foxp3+ iTreg cells were assayed by FCM (left) and quantified (right). (B–F) Data represent mean ± SD of three (D–F) or four (B, C) independent experiments, with significance determined by one-way analysis of variance (ANOVA) test. **p<0.01, ***p<0.001, and ****p<0.0001; ns, nonsignificant.

Figure 2.

Figure 2—figure supplement 1. Detection of metabolic intermediates in mevalonate-cholesterol synthesis pathway upon ACLY inhibition.

Figure 2—figure supplement 1.

(A–D) Naive CD4+ T cells treated with SB204990 were cultured under inducible regulatory T (iTreg)-polarization condition as in Figure 1E. Cells were lysed for the detection of HMG-CoA (A), mevalonate (B), and mevalonate-5-pyrophosphate (C) by enzyme-linked immunosorbent assay (ELISA) or stained by Filipin III for evaluating cholesterol by flow cytometry (FCM) (D). Data represent mean ± SD of four independent experiments, with significance determined by Student's t-test. ns, nonsignificant.
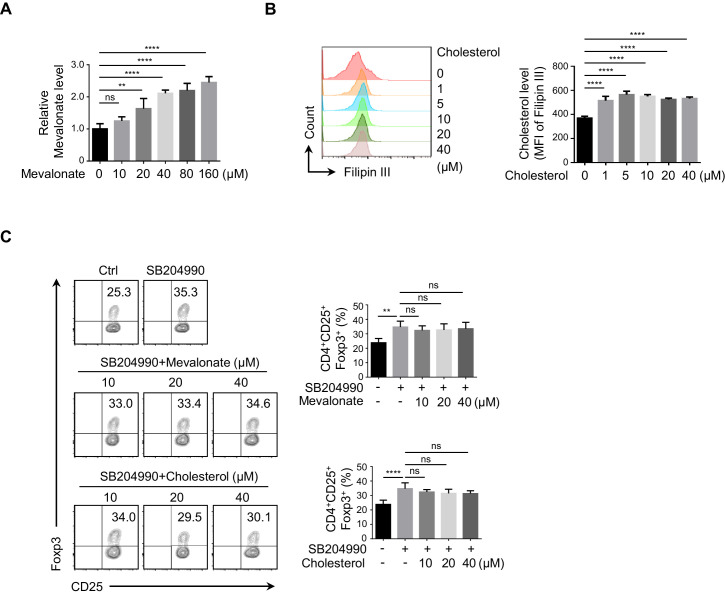
Figure 2—figure supplement 2. Impact of mevalonate and cholesterol on iTreg differentiation.

Figure 2—figure supplement 2.

(A, B) Assay for mevalonate and cholesterol. Naive CD4+ T cells were cultured under inducible regulatory T (iTreg)-polarization condition as in Figure 1E for 24 hr in the presence of variable doses of mevalonate (A) or cholesterol (B). Levels of mevalonate (A) or cholesterol (B) were evaluated by enzyme-linked immunosorbent assay (ELISA) and flow cytometry (FCM), respectively. (C) Influence from mevalonate and cholesterol on ATP-citrate lyase (ACLY)-inhibition-induced iTreg differentiation. Naive CD4+ T cells were cultured as in Figure 1E in the presence of different doses of mevalonate or cholesterol for 72 hr. Subsequently, CD4+CD25+Foxp3+ iTreg cells were analyzed by FCM (left) and quantified (right). (A–C) Data represent mean ± SD of three (A, B) or four (C) independent experiments, with significance determined by one-way analysis of variance (ANOVA) test. **p<0.01, ****p<0.0001; ns, nonsignificant.
Figure 2—figure supplement 3. Examination of nuclear acetyl-CoA and histone acetylation upon ACLY inhibition.

Figure 2—figure supplement 3.

(A–D) Cells prepared as in Figure 1E for 24 hr were fractionated (A) and evaluated for nuclear acetyl-CoA (B). Acetylation in total histones (C) and H3/H4 from whole-cell lysates (D) were assessed. (B–D) Quantification shows mean ± SD based on three independent experiments, with significance determined by Student's t-test. ns, nonsignificant. For western blot (WB) in (A), (C), and (D), one representative experiment out of three is represented. Associated scores indicate mean intensities based on three biological replicas.
Figure 2—figure supplement 4. Functional comparison between ACC and FASN in ACLY-inhibition-induced iTreg differentiation.

Figure 2—figure supplement 4.

(A) Assay for palmitate in cells. Naive CD4+ T cells were cultured under inducible regulatory T (iTreg)-polarization condition as in Figure 1—figure supplement 1A for 24 hr in the presence of variable doses of Bodipy-palmitate prior to flow cytometry (FCM) evaluation (left) and quantification (right). (B) Fatty acid synthesis (FAS) and fatty acid oxidation (FAO) pathways. (C) Assay of iTreg differentiation upon acetyl-CoA carboxylase (ACC) or fatty acid synthase (FASN) inhibition. Naive CD4+ T cells were cultured as in Figure 1E. In the presence of variable doses of ACC inhibitor (PF05175157) or FASN inhibitor (cerulenin), cells positive for CD4/CD25/Foxp3 were evaluated with FCM (left) and quantified (right). (D) Analysis of malonyl-CoA level upon ATP-citrate lyase (ACLY) inhibition. Naive CD4+ T cells cultured as in Figure 1E for 24 hr were analyzed for malonyl-CoA by high-performance liquid chromatography (HPLC). (A, C, D) Data represent mean ± SD of three independent experiments, with significance determined by one-way analysis of variance (ANOVA) test (A, C) or Student's t-test (D). *p<0.05, **p<0.01, and ****p<0.0001; ns, nonsignificant.
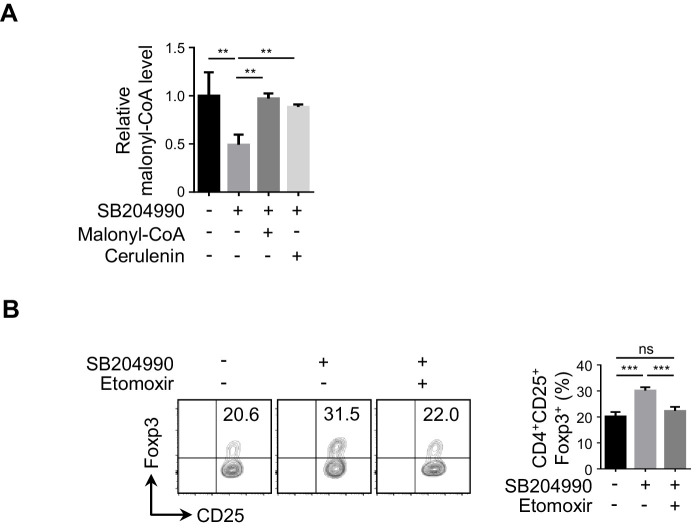
Figure 2—figure supplement 5. Functional evaluation of CPT1 in ACLY-inhibition-induced iTreg differentiation.

Figure 2—figure supplement 5.

(A) Assay of malonyl-CoA level. Naive CD4+ T cells were cultured as in Figure 1E for 24 hr in the presence of malonyl-CoA (50 μM) or cerulenin (4 μM), and malonyl-CoA level was analyzed by high-performance liquid chromatography (HPLC). (B) Impact of carnitine palmitoyltransferase 1 (CPT1) inhibition on inducible regulatory T (iTreg) differentiation. Naive CD4+ T cells were cultured as in Figure 1E in the presence of etomoxir (5 μM). CD4+CD25+Foxp3+ iTreg cells were analyzed by flow cytometry (FCM) (left) and quantified (right). Data represent mean ± SD of three independent experiments, with significance determined by one-way analysis of variance (ANOVA) test. **p<0.01, ***p<0.001; ns, nonsignificant.