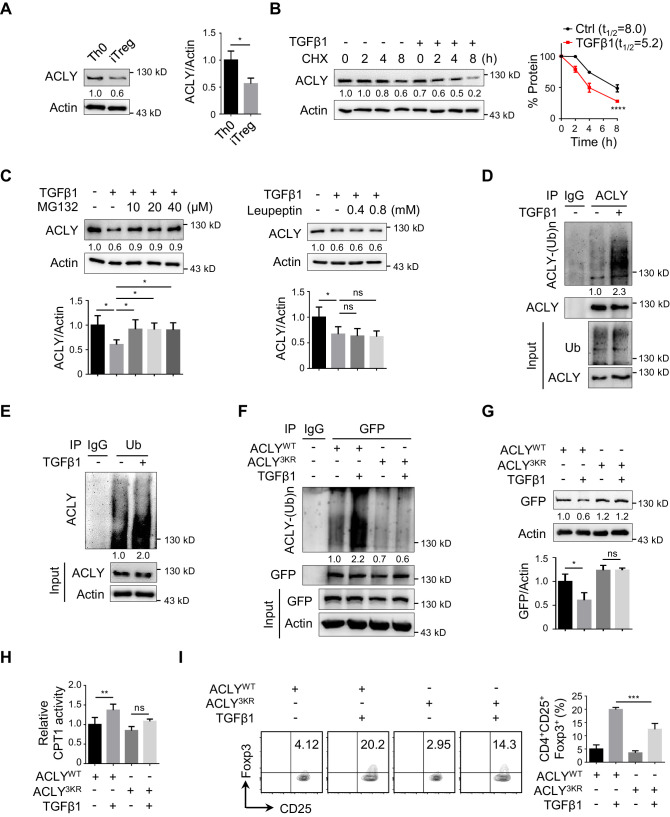
Figure 3. TGFβ1 induces ACLY ubiquitination and degradation during iTreg differentiation.
(A) Assay of ATP-citrate lyase (ACLY) protein level. Activated T (Th0) and inducible regulatory T (iTreg) cells prepared as in Figure 1A were subjected to western blot (WB) with antibodies against ACLY (left). Quantification of ACLY levels (right). (B) Impact of transforming growth factor β1 (TGFβ1) on ACLY degradation. Naive CD4+ T cells were cultured as in Figure 1A for 24 hr and treated with cycloheximide (CHX) (10 μg/ml) as indicated prior to WB analysis (left). Quantification of ACLY levels (right). (C) Pathway analysis for ACLY degradation. Th0 and iTreg cells polarized as in Figure 1A for 24 hr were treated with MG132 (left) or leupeptin (right) and analyzed with WB for ACLY protein. (D, E) Impact of TGFβ1 on ACLY ubiquitination. Cells polarized as in Figure 1A for 24 hr were treated with MG132 (10 μM) and cell extracts were immunoprecipitated with antibodies against ACLY (D) or ubiquitin (Ub) (E). IgG serves as a negative control. (F–H) Functional comparison between ACLYWT and ACLY3KR. Naive CD4+ T cells transfected with GFP-ACLYWT or -ACLY3KR were polarized as in Figure 1A for 24 hr. (F) Extracts from cells pre-treated with MG132 were assayed with immunoprecipitation (IP) for ACLY ubiquitination. IgG serves as a negative control. (G) WB analysis for ACLY protein. (H) Cell lysates were prepared for the analysis of carnitine palmitoyltransferase 1 (CPT1) activity. (I) ACLY ubiquitination impacts on iTreg differentiation. Cells transfected with GFP-ACLYWT or -ACLY3KR were polarized as in Figure 1A and assessed with flow cytometry (FCM) (left). Quantification of GFP+CD25+Foxp3+ iTreg cells (right). (A–C, G–I) Quantification shows mean ± SD based on three independent experiments. Student's t-test (A), two-way analysis of variance (ANOVA) test (B), or one-way ANOVA test (C, G–I) was used. *p<0.05, **p<0.01, ***p<0.001, and ****p<0.0001; ns, nonsignificant. For WB in (A–G), one representative experiment out of three is represented. Associated scores indicate mean intensities based on three biological replicas.


