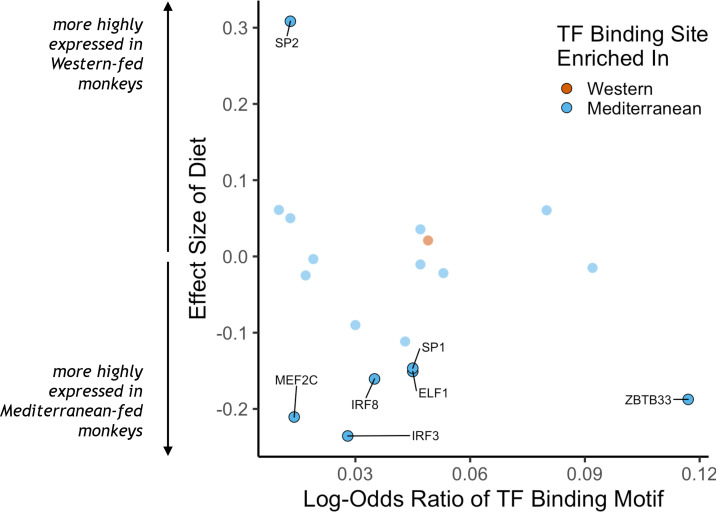
Figure 2. Transcription factor (TF) binding motifs correlated with diet effects on gene expression.
The log-odds ratio of TF binding motif enrichment in Western genes (orange) or Mediterranean genes (blue) are depicted on the x-axis. The y-axis shows the effect size of diet on the expression of the gene that encodes for the TF. Only TFs with binding motifs significantly enriched in either gene set and that were detectably expressed in our samples are shown, with those significantly affected by diet (FDR < 0.05) outlined and labeled.

