. 2021 Aug 20;10:e69142. doi: 10.7554/eLife.69142

Figure 1. HiLITR gives transcriptional readout of protein localization in living cells.

(A) Schematic of HiLITR. HiLITR has two components: a low-affinity protease (green) and a membrane-anchored transcription factor (TF, red). Left: when protease and TF are colocalized on the same organelle, and 450 nm blue light is supplied, the TF is released by proximity-dependent cleavage and drives reporter gene expression. Right: when protease and TF are not colocalized, HiLITR is off. (B) Domain structures of HiLITR components and timeline for HiLITR usage. The targeting domain is a protein or localization peptide that directs the TF/protease to the desired subcellular region (such as the mitochondrion in A, left). (C) Fluorescence images of HiLITR in HeLa cells. TF is on the outer mitochondrial membrane (OMM), and protease is localized to the OMM (top row), ER membrane (middle), or cytosol (bottom). mCherry is the reporter gene and TOMM20 is a mitochondrial marker. Cells were stimulated with 450 nm light for 3 min, then fixed and stained 8 hr later. Scale bars, 10 µm. (D) Fluorescence-activated cell sorting (FACS) plots of K562 cells expressing HiLITR. TF is on the OMM (top row) or ER membrane (bottom row), while protease localization is varied as indicated. Light stimulation was 3 min. mCherry on the y-axis reports HiLITR activation, and GFP on the x-axis reports protease expression level. Percentage of cells above the red line is quantified in each plot. (E) Model selection on K562 cells expressing HiLITR TF on mitochondria. Cells with mitochondrial protease (colocalized with TF) versus cytosolic protease (not colocalized with TF) were combined in a 1:20 ratio. Cells were stimulated with light for 3.5 min and sorted for high mCherry expression 8 hr later. (F) qPCR analysis of mito- and cyto-protease transcript from predefined, pre-sort, and post-sort cell mixtures from (E). Mito-protease cells were enriched 308-fold over cyto-protease cells in one round of FACS sorting. Full data in Figure 1—source data 1.

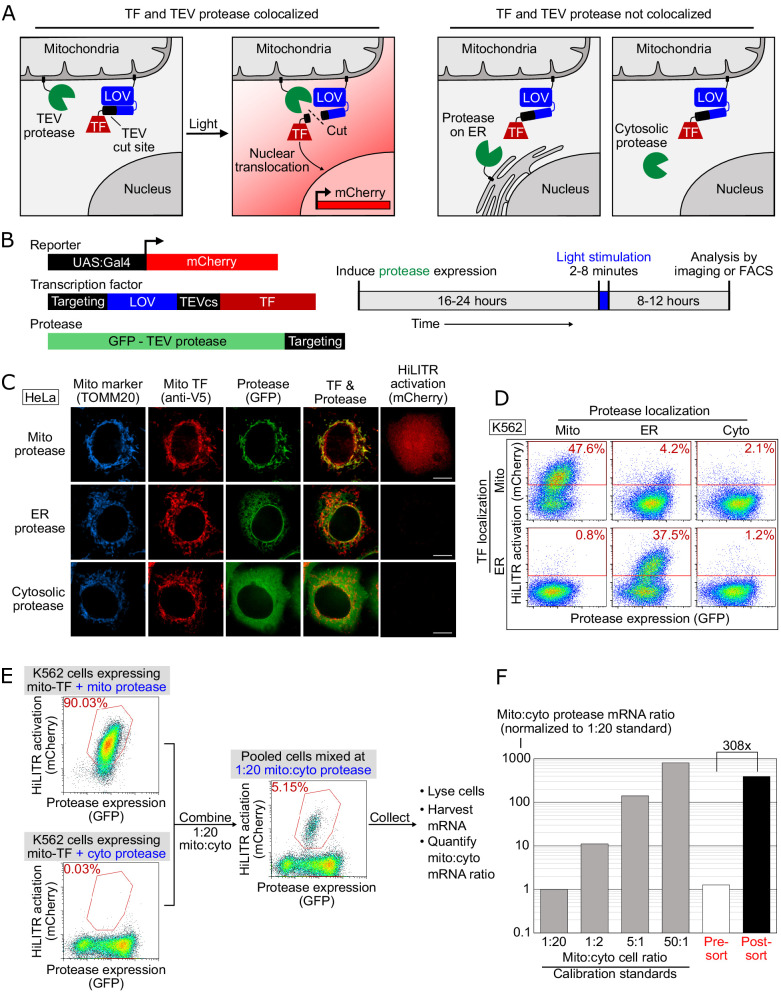
Figure 1—source data 1. Source data for Figure 1F.

Figure 1.

Figure 1—figure supplement 1. Details for HiLITR constructs used in this study.

Figure 1—figure supplement 1.

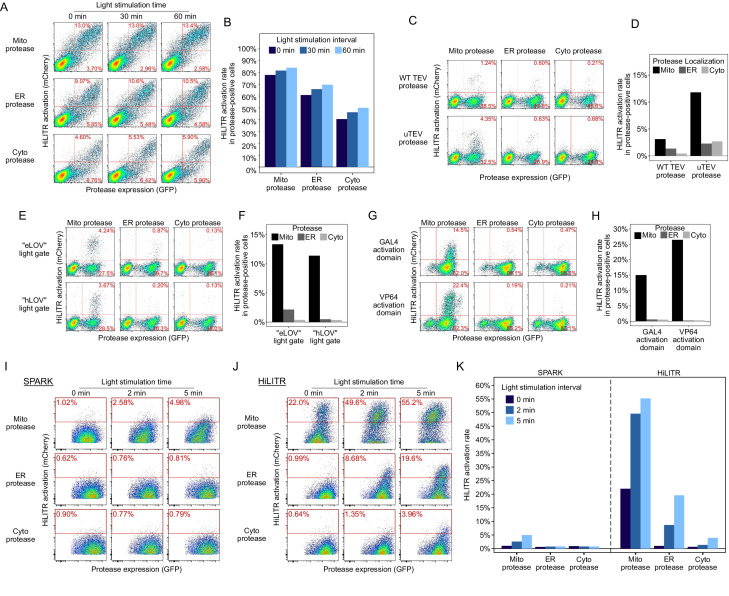
LOV, TF, and TEV protease domains used in Figure 1—figure supplements 2 and 3 (HiLITR optimization) vary slightly. Any differences are shown and discussed in the text.
Figure 1—figure supplement 2. Sequential optimization of HiLITR components.

Figure 1—figure supplement 2.

(A) Fluorescence-activated cell sorting (FACS) plots of HEK cells transiently transfected with unoptimized HiLITR components. Transcription factor (TF) is on the outer mitochondrial membrane (OMM), while protease is localized to the OMM (top row), ER membrane (middle), or cytosol (bottom). mCherry on the y-axis reports HiLITR turn-on, while GFP on the x-axis reports protease expression level. In (A), (C), (E), and (G), the percentage of cells in each of the two right quadrants is shown in red. The TF component contains ‘eLOV’ (Wang et al., 2017) and the GAL4 activation domain. The protease used here is wild-type TEV truncated at amino acid 219 (Wang et al., 2017). (B) Quantitation of the results in (A). The fraction of cells expressing both protease and reporter (top value in FACS plot) was divided by the total fraction of protease-positive cells (sum of top and bottom values). (C) FACS plots of K562 cells stably expressing HiLITR TF and mCherry reporter, and transduced with mitochondrial, ER, or cytosolic protease. Truncated wild-type TEV protease (top row) or ultraTEV (uTEV) protease (Sanchez and Ting, 2020; bottom row) were used. 2 min of light stimulation. (D) Quantitation of the results in (C). (E) FACS plots of K562 cells stably expressing mCherry reporter and TF containing ‘eLOV’ or improved ‘hLOV’ (Kim et al., 2017). Cells were transduced with uTEV protease targeted to the mitochondria, ER, or cytosol. No light stimulation was used. hLOV reduces background signal. (F) Quantitation of the results in (E). (G) FACS plots of K562 cells stably expressing mCherry reporter, protease, and GAL4 or VP64 TF activation domain variant. No light stimulation was used. (H) Quantitation of the results in (G). (I) FACS plots of K562 cells stably expressing mCherry reporter with our previously described SPARK tool (Kim et al., 2017). Protease was tested at the OMM, ERM, and cytosol, with 0, 2, or 5 min of light stimulation. (J) Same as (I), but with the optimized HiLITR components (mitochondrial TF, mitochondrial ‘TA protease,’ ER protease, and cytosolic protease shown in Figure 1—figure supplement 1). SPARK and optimized HiLITR differ in their TF and protease domains. (K) Quantitation of results in (I) and (J).
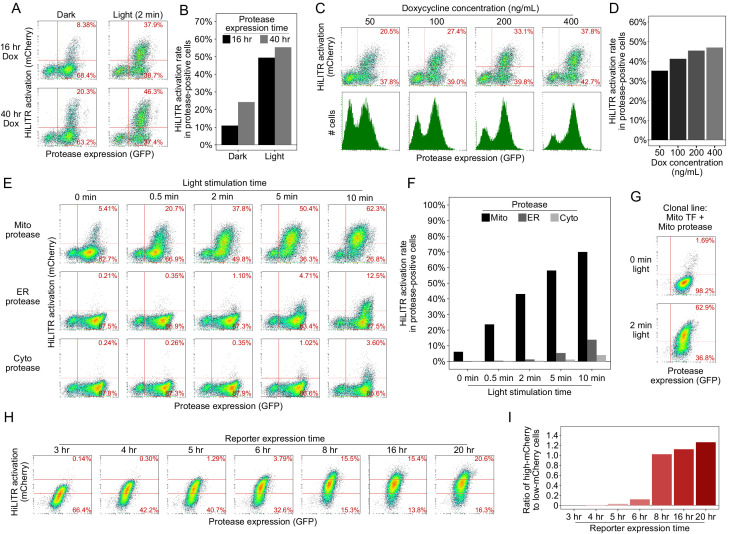
Figure 1—figure supplement 3. Optimization of HiLITR experimental parameters.

Figure 1—figure supplement 3.

(A) Fluorescence-activated cell sorting (FACS) plots of K562 cells stably expressing optimized mitochondrial HiLITR components (outer mitochondrial membrane [OMM]-targeted protease and transcription factor [TF]). Protease expression was induced with doxycycline for either 16 hr or 40 hr, and cells were left in the dark or exposed to light for 2 min. In (A), (C), (E), and (H), the percentage of cells in each right quadrant is quantified and shown in red. (B) Quantitation of the results in (A). The fraction of cells expressing both protease and reporter was divided by the total fraction of protease-positive. (D), (F), and (I) are quantified in the same manner. (C) FACS plots of K562 cells stably expressing optimized mitochondrial HiLITR components. Protease expression was induced for 16 hr with 50–400 ng/mL doxycycline. Light stimulation was provided for 2 min. HiLITR activation (top row) and total protease expression (bottom row, green histogram; the 50 ng/mL doxycycline condition is overlayed in gray) were measured across conditions. (D) Quantitation of the results in (C). (E) FACS plots of K562 cells stably expressing mitochondrial HiLITR TF and the indicated proteases. Light stimulation was varied between 0 and 10 min. Quantitation of the results in (E). The best specificity was achieved with 2 min of light stimulation. (F) FACS plots of a clonal K562 cell line stably expressing mitochondrial TF, mitochondrial protease, and mCherry reporter (compare to mito protease in non-clonal stable K562s, top row of E). (G) The clonal cell line in (G) was stimulated with light for 3 min, then cultured for 3–20 hr before FACS analysis. The percentage of cells with high mCherry expression (above the top red line) or low mCherry expression (below the bottom red line) is shown in each plot. (H) Quantitation of the results in (G). We used 8 hr for mCherry expression in subsequent experiments.
Figure summary - Optimization of HiLITR experimental parameters. After optimization of HiLITR components to minimize background and maximize dynamic range, we investigated the modulation of experimental parameters in the HiLITR assay. First, we looked at expression of the protease. The HiLITR protease is under the expression of a doxycycline inducible promoter to avoid prolonged stable expression of both HiLITR components and to enable cell culturing in ambient light prior to induction of the protease. Reducing the protease expression time window from 40 hr to 16 hr prior to light stimulation improved the signal to noise ratio between the light and dark states from 2.3-fold to 4.9-fold with 2 min of light stimulation, with only ~10% reduction in activation in the light state (A, B). Varying the concentration of doxycycline used to induce protease expression had a modest impact on HiLITR activation, the proportion of protease-positive cells, and total protease expression (C, D). Next, we asked how HiLITR performance varied with light stimulation time. By varying light stimulation time from 0 to 10 min, we found that we could achieve robust HiLITR activation with the mitochondrial protease while maintaining low background with the ER and cytosolic proteases with just 2–5 min of light stimulation time (E, F). In this experiment, 2 min of light stimulation gave a ±light signal to noise ratio of 7× and a ±colocalization signal ratio of 35× (activation of HiLITR mito TF with mitochondrial vs. ER protease). To improve light vs. dark signal to noise, we considered that in the heterogenous population of cells, there were likely some cells that produced light-independent cleavage and other cells that never produced TF cleavage under even extended light stimulation. Reducing cell-to-cell variability is desirable in gene-perturbation studies, so we generated clonal cell lines for testing. We identified a clonal population that gave only 1.7% activation in the dark state but 63% activation with 2 min of light stimulation (G), a signal to noise ratio of 37×. Because this clone showed lower activation in the dark state and higher activation in the light state than the heterogeneous population, we reasoned that it must represent an intermediate level of HiLITR sensitivity. Finally, we tested the change in HiLITR readout with respect to time of reporter expression after light stimulation. In large screens, time of FACS sorting is non-negligible, so it is important to have a readout that is stable with time. With our clonal line, we found that a minimum of 8 hr is required for robust reporter expression, and reporter levels are stable between 8 and 20 hr post-stimulation (H, I). It is likely that keeping cell samples on ice after 8 hr of reporter expression further stabilized total reporter levels in our high-throughput screens.
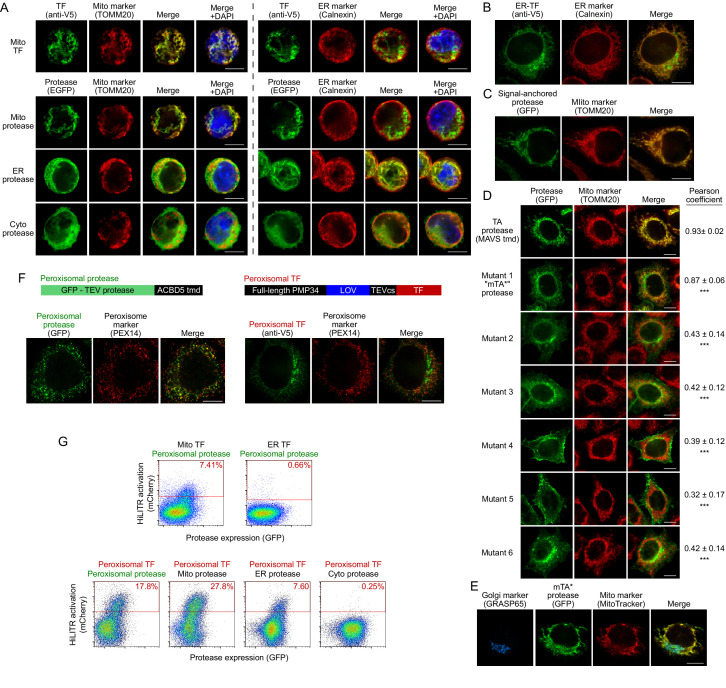
Figure 1—figure supplement 4. Additional characterization of HiLITR constructs and cell lines.

Figure 1—figure supplement 4.

(A) Immunofluorescence microscopy of stably-integrated HiLITR components used in fluorescence-activated cell sorting (FACS) experiment in Figure 1D. The localizations of the mitochondrial transcription factor (TF) (V5 tag, top row) and protease constructs (bottom three rows) were compared to nuclear (DAPI), mitochondrial (TOMM20), and ER (Calnexin) markers in K562 cells. Scale bars, 10 µm. (B) Immunofluorescence microscopy of the ER-localized HiLITR TF used in Figures 1D, 2D and E (‘ER transcription factor’ in Figure 1—figure supplement 1). In HeLa cells, the localization of the ER transcription factor (V5 tag) was compared to an ER marker (Calnexin). A fraction of the ER-TF localizes to a non-ER region, consistent with the dual localization of TMED3 (from which the targeting domain was derived) to ER and Golgi membranes (Emery et al., 2000; Jenne et al., 2002). Scale bar, 10 µm. (C) Immunofluorescence microscopy of the signal-anchored mitochondrial protease used in Figure 2C and E (‘Signal-anchored protease’ in Figure 1—figure supplement 1). In HeLa cells, the localization of the signal-anchored protease (GFP) was compared to a mitochondrial marker (TOMM20). Scale bar, 10 µm. (D) Immunofluorescence microscopy of the mutant mitochondrial tail-anchored protease (mutant 1, ‘mTA* protease’ in Figure 1—figure supplement 1) and variants (mutants 2–6; sequences in Materials and methods). HeLa were stained with anti-TOMM20 to visualize mitochondria. Scale bars, 10 µm. At right, mean and standard deviation for Pearson’s correlation coefficient between the protease and mito marker channels (n = 10–30 cells per condition). ***p<0.001, vs. TA protease, Wilcoxon rank-sum test. (E) Same as (D) (‘mTA* protease’, mutant 1) but with additional Golgi stain (anti-GRASP65). Scale bar, 10 µm. (F) HiLITR constructs for detection of protein colocalization at the peroxisome. Top: domain structures of peroxisome-targeted HiLITR TF and protease constructs. The TF and protease domains face the cytosol. Bottom: localization of HiLITR constructs in HeLa, using PEX14 peroxisomal marker. Note that despite testing numerous targeting signals, we were unable to generate a peroxisomal TF with clean localization. Scale bars, 10 µm. (G) FACS analysis of K562 cells expressing the indicated HiLITR combinations, 8 hr after 3 min light stimulation. Percentage of cells in the red gate is quantified in each plot. Mito-TF and ER-TF data was obtained as part of the experiment in Figure 1D. HiLITR at the peroxisomal membrane.
Figure summary - Generation of the mutant tail-anchored mitochondrial protease (mTA* protease). For the ER screen (Figure 2), we sought to generate a mutant tail-anchored mitochondrial protease with a greater propensity to mistarget to the ER. To do this, we considered the features of tail-anchored proteins which promote ER vs. mitochondrial targeting. Tail-anchor sequences of native ER proteins tend to be longer, more hydrophobic, and have fewer basic flanking residues than mitochondrial tail-anchor sequences (Beilharz et al., 2003; Costello et al., 2017; Horie et al., 2002). We found that neutralizing just one of three positive residues flanking the transmembrane domain in our MAVS-based mito TA protease produced detectable mislocalization to the ER and Golgi (mutant 1, D, E), while other mutations disrupted mitochondrial localization too severely (D). Note that localization of protease variants in (D) to the Golgi and plasma membrane is a consequence of further trafficking after initial insertion at the ER (Borgese et al., 2019). We selected mutant 1, a MAVS-R537A mutant of the mito TA construct (‘mTA* protease,’ D) for our ER screen. The additional mutant constructs are described in Supplementary file 1.
Figure summary - HiLITR at the peroxisomal membrane. As part of our HiLITR panel in Figure 1D, we also tested the mitochondrial TF and ER-TF against a peroxisomal protease (localization in F). As expected, there was no HiLITR activation with the ER-TF by the peroxisomal protease (G). Interestingly, the peroxisomal protease did induce mild HiLITR activation with the mitochondrial TF (G). This may be due to mitochondria-peroxisome contact sites (Chen et al., 2020), which could produce crosstalk between protease and TF constructs on neighboring membranes. We also attempted to generate a HiLITR TF for the peroxisomal membrane. Unfortunately, despite testing numerous fusion constructs incorporating both short targeting domains and full-length peroxisomal proteins, we observed leak to non-peroxisome locations in HeLa cells. Our most cleanly targeted peroxisomal TF fusion was based on full-length PMP34, but still showed obvious mistargeting to non-peroxisomal compartments (F). Peroxisomes are formed in a process that involves both the ER and the mitochondrial membranes (Sugiura et al., 2017), and many peroxisome membrane proteins insert at one or both locations, to be subsequently trafficked into newly derived peroxisomes. It is likely that overexpression of the peroxisomal TF construct produces pools of TF on the mitochondria and/or ER that are too abundant to be efficiently concentrated into nascent peroxisomal membranes. The phenomenon of peroxisomal fusion constructs mislocalizing to the mitochondria or ER has been previously observed (Kim et al., 2006; Sugiura et al., 2017). Consistent with the incomplete targeting of the peroxisomal TF to the peroxisome, we observed HiLITR activation when our peroxisomal TF was paired with the peroxisomal, mitochondrial, or ER proteases (G). HiLITR activation with the mitochondrial protease was slightly greater than with the peroxisomal protease, which is likely a result of higher expression of the mitochondrial protease relative to the peroxisomal protease, as well as the mislocalization of the peroxisomal TF. Importantly, cytosolic protease did not activate reporter expression with the peroxisomal TF (G), indicating that colocalization is still a requirement for TF release.
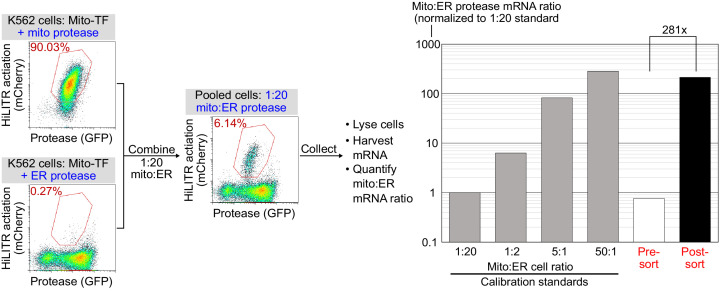
Figure 1—figure supplement 5. Model selection on K562 cells expressing mitochondrial transcription factor (TF) HiLITR.

Figure 1—figure supplement 5.

Same as Figure 1E and F, except that cells expressing mitochondrial protease (colocalized with TF) are combined with cells expressing ER protease (rather than cytosolic protease as in Figure 1E). Cells were combined in a 1:20 ratio as indicated, stimulated with light for 3 min, and sorted for high mCherry expression 8 hr later. qPCR analysis of mito- and ER-protease transcript from predefined, pre-sort, and post-sort cell mixtures showed a 281-fold enrichment of mito-protease cells over ER-protease cells in one round of sorting. Full data in Figure 1—figure supplement 5—source data 1.
Figure 1—figure supplement 5—source data 1.