. 2021 Aug 20;10:e69142. doi: 10.7554/eLife.69142

Figure 5. SAE1 knockdown reduces the abundance of many endogenous mitochondrial tail-anchored (TA) proteins.

(A) HeLa cells infected with SAE1 sgRNA or nontargeting control for 9 days were analyzed by western blot. Three TA mitochondrial proteins (MAVS, SYNJ2BP, FIS1) were analyzed in addition to three non-TA mitochondrial proteins (COX4, VDAC1, AKAP1). Uncropped blots in Figure 5—figure supplement 1. (B) Quantification of data in (A) along with two additional biological replicates per condition. Error bars = SEM. *p<0.05, **p<0.01, Student’s t-test. Full data in Figure 5—source data 1. (C) Proteomic analysis of endogenous mitochondrial protein abundance in whole-cell lysate from SAE1 knockdown HeLa cells. Enrichment scores (abundance in SAE1 knockdown samples relative to abundance in nontargeting control samples; same samples as in Figure 5—figure supplement 3) were normalized to the mean mitochondrial protein abundance. Dashed line, p=0.05. Full volcano plot in Figure 5—figure supplement 4. (D) Percentage of different protein classes whose abundance positively correlates with that of SAE1 (red). TA: mitochondrial tail-anchored proteins; SA: mitochondrial signal-anchored proteins; OMM: other transmembrane outer mitochondrial membrane proteins; other: all other mitochondrial proteins. **p<0.01, chi-square test against ‘other’ mitochondrial proteins.

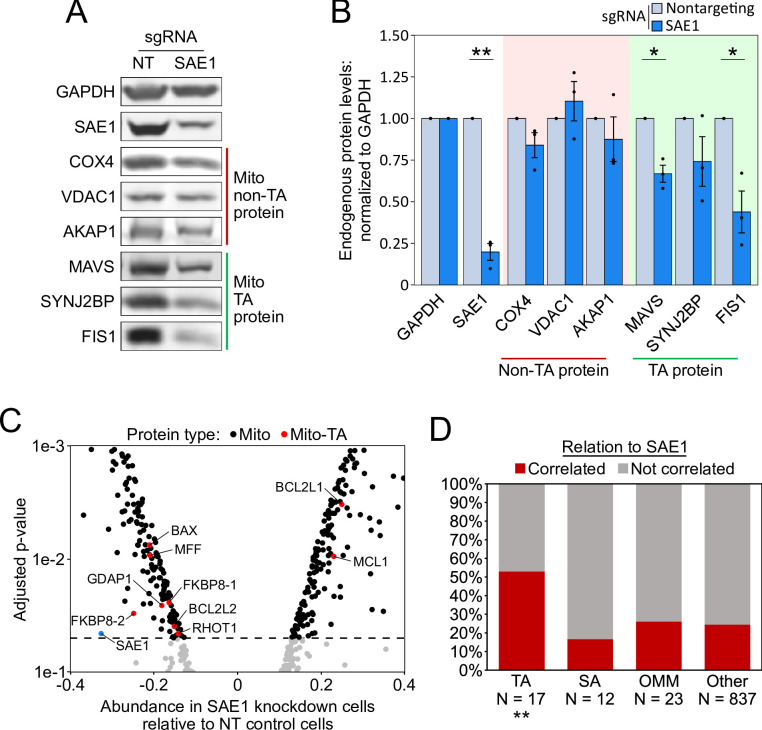
Figure 5—source data 1. Source data for Figure 5B.

Figure 5.

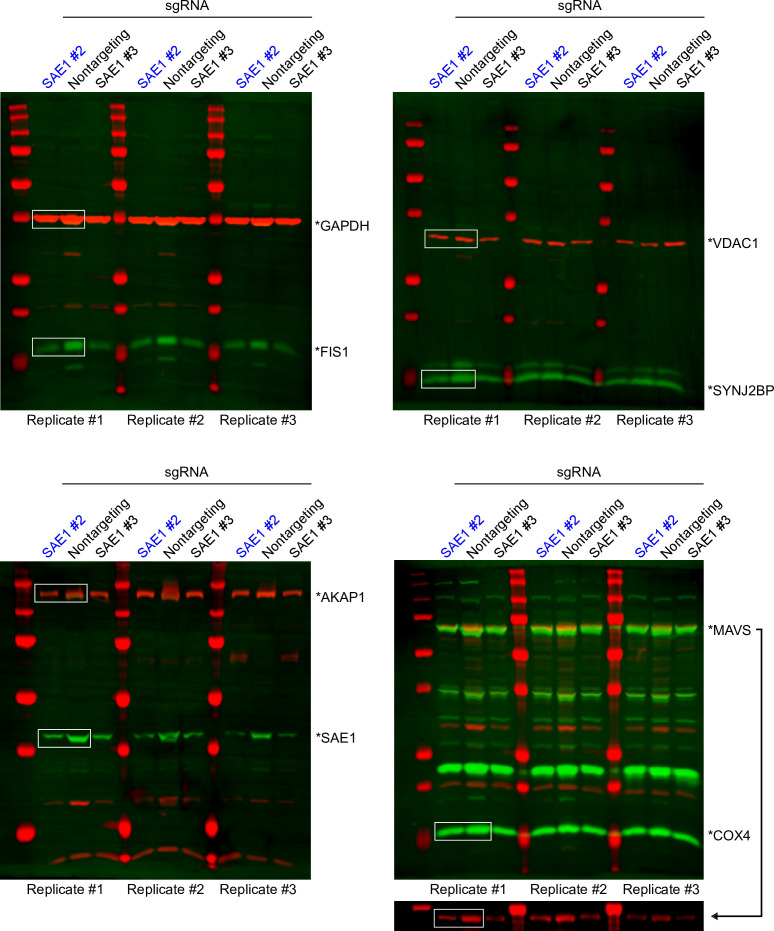
Figure 5—figure supplement 1. Uncropped western blots used to make Figure 5A and B.

Figure 5—figure supplement 1.

Data from sgRNA #2 (blue) was used to generate Figure 4A (boxed regions).
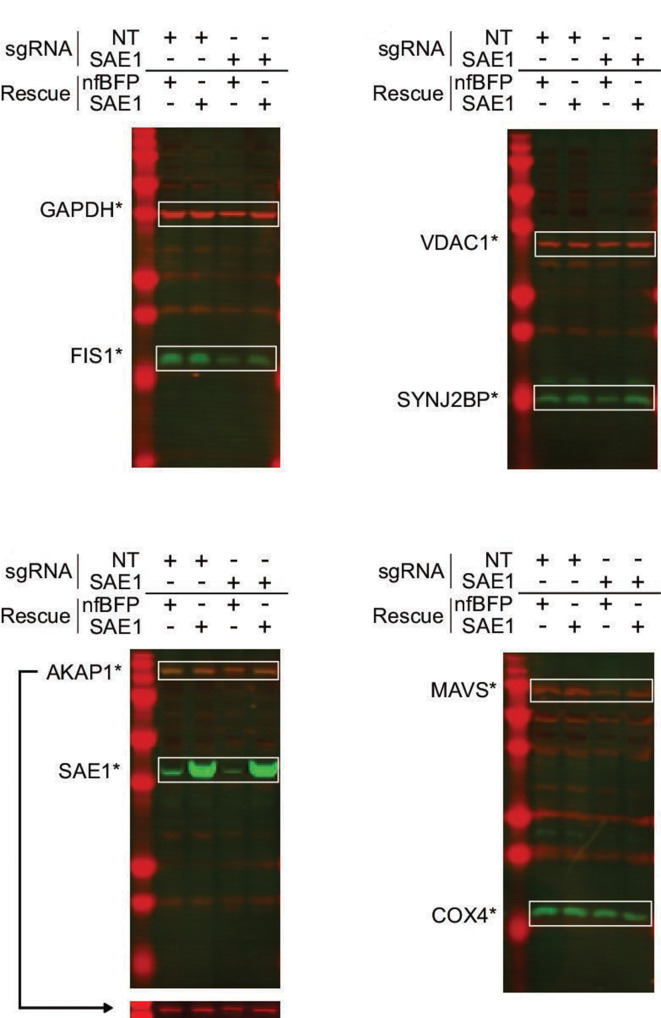
Figure 5—figure supplement 2. Western blots of SAE1 knockdown and rescue.

Figure 5—figure supplement 2.

HeLa cells expressing dCas9-KRAB were infected for 9 days with either nontargeting control (NT) or sgRNA against SAE1. Each sample was further transduced with either sgRNA-resistant SAE1 or nonfluorescent BFP control (nfBFP). The abundance of endogenous mitochondrial proteins, SAE1, and GAPDH loading control was measured for each sample.
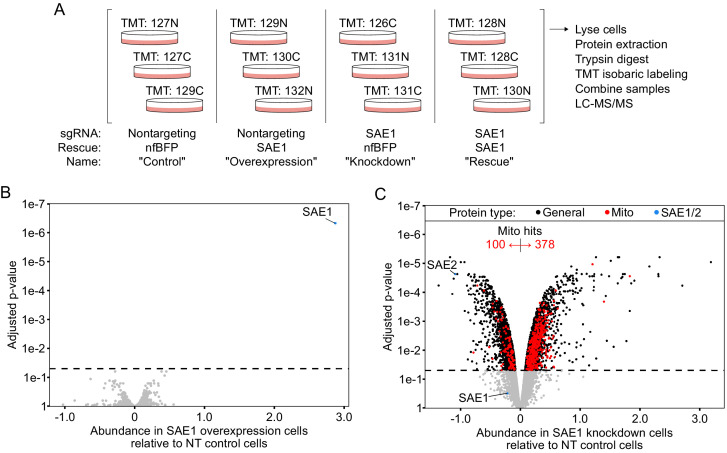
Figure 5—figure supplement 3. Whole-proteome profiling data.

Figure 5—figure supplement 3.

(A) Overview of proteomic experiment. HeLa cells expressing either sgRNA-resistant SAE1 or nonfluorescent BFP (nfBFP) were infected with either nontargeting control sgRNA or sgRNA against SAE1 for 9 days. Whole-cell lysate in triplicate samples was analyzed by mass spectrometry. (B) Overexpression of SAE1 does not alter proteome stability. Samples with nontargeting sgRNA and SAE1 rescue (‘overexpression’) were compared to samples with nontargeting sgRNA and nfBFP rescue (‘control’). Within each sample, data were normalized to median protein abundance prior to statistical analysis. Overexpression of SAE1 only significantly alters the abundance of SAE1. Dashed line, p=0.05. (C) Knockdown of SAE1 differentially alters the stability of the mitochondrial proteome. Samples with SAE1 sgRNA and nfBFP rescue (‘knockdown’) were compared to samples with nontargeting sgRNA and nfBFP rescue (‘control’). When data are normalized to median protein abundance, we observe that SAE1 knockdown significantly alters the abundance of about half the proteome (1830 down, 2195 up, 5587 unaltered). Interestingly, SAE2 is one of the most significantly depleted proteins, suggesting coregulation of the SAE1/SAE2 heterodimer. In contrast to the overall proteome, the mitochondrial proteome abundance is specifically increased upon SAE1 knockdown (100 mitochondrial proteins down in abundance, 378 up, 411 unaltered). Note that the knockdown of SAE1 is surprisingly not classified as significant when data are normalized to median protein abundance.
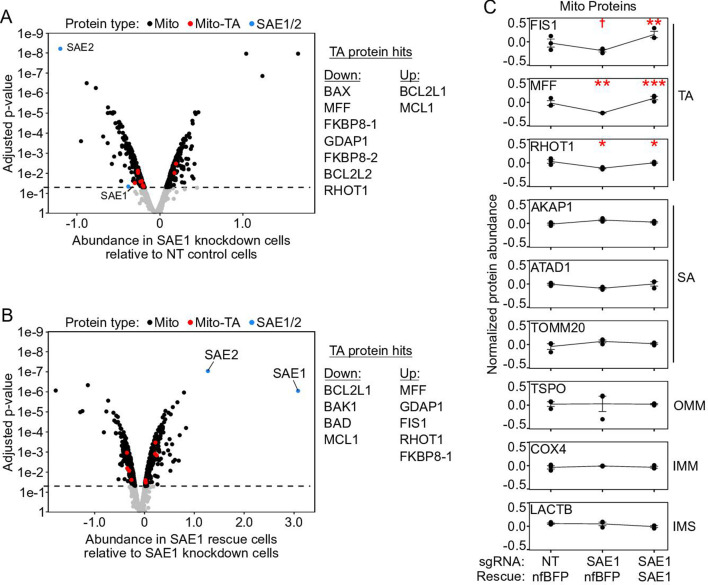
Figure 5—figure supplement 4. Mitochondrial proteome data normalized to mean mitochondrial protein abundance.

Figure 5—figure supplement 4.

(A) Same as Figure 5C, but zoomed out to show the entire volcano plot. HeLa cells expressing nonfluorescent BFP (nfBFP) were infected with sgRNA against SAE1 (‘SAE1 knockdown’) or with nontargeting control (‘NT control’; same samples as Figure 5C and Figure 5—figure supplement 3C). Data were normalized to the mean of the mitochondrial proteome, rather than to that of the cellular proteome. The depletion of SAE1 is significant when data are normalized in this way. Upon knockdown of SAE1, seven tail-anchored proteins are significantly depleted while two are enriched (compared to 202 depleted and 197 enriched for the mitochondrial proteome overall). Note that FKBP8-1/2 are different isoforms of FKBP8 that were separately detected in the proteomic analysis. In western blot experiments, the largest isoform of the tail-anchored protein MAVS was depleted (Figure 5A and B and Figure 5—figure supplements 1 and 2, MW 57 kDa). The proteomics data does not distinguish between large isoform MAVS and its five smaller isoforms, four of which lack the C-terminal transmembrane domain. This may be why the proteomics data does not show a change in endogenous MAVS abundance when SAE1 is knocked down, whereas our western blot data in Figure 5A and B does. (B) Overexpression of SAE1 rescues the effects of SAE1 knockdown. HeLa cells expressing sgRNA-resistant SAE1 and sgRNA against endogenous SAE1 (‘SAE1 rescue’) were compared to the SAE1 knockdown cells from (A). Proteins that were significantly depleted upon SAE1 knockdown vs. nontargeting control are generally enriched upon SAE1 vs. nfBFP overexpression, and vice versa. (C) Representative traces of protein abundance in basal (left), SAE1 knockdown (middle), or SAE1 rescue (right) conditions. Data shown for three tail-anchored, three signal-anchored, one outer mitochondrial membrane, one inner mitochondrial membrane, and one intermembrane space protein. The three tail-anchored proteins track with the abundance of SAE1 itself. p<0.10, *p<0.05, **p<0.01, ***p<0.001, moderated t-test.
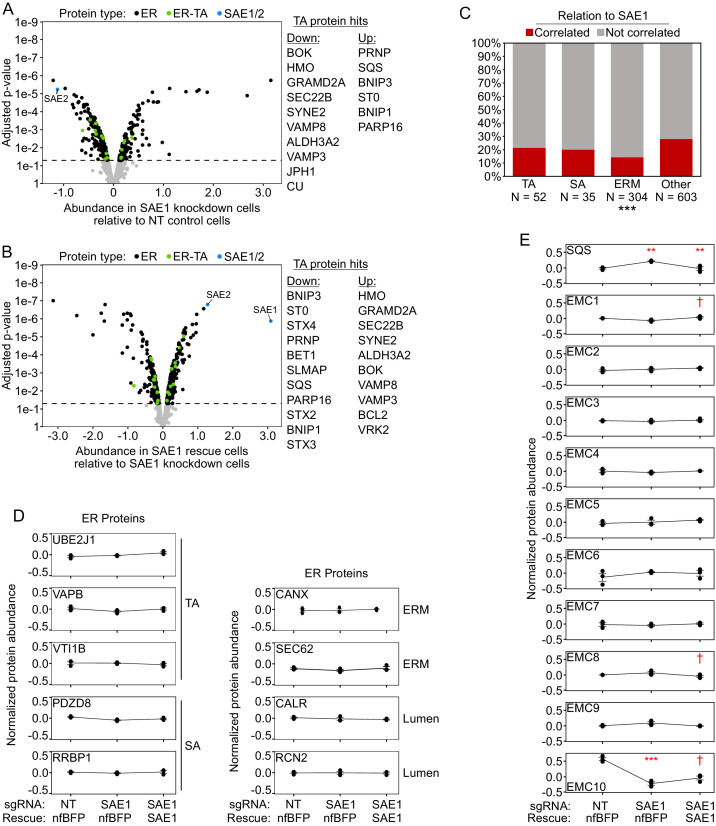
Figure 5—figure supplement 5. ER proteome data normalized to mean ER protein abundance.

Figure 5—figure supplement 5.

(A) Knockdown of SAE1 does not significantly affect ER tail-anchored protein abundance relative to other ER proteins. HeLa cells expressing nonfluorescent BFP and sgRNA against SAE1 (‘SAE1 knockdown’) or nontargeting control (‘NT control’; same samples as Figure 5C and Figure 5—figure supplement 3C) were analyzed by filtering the mass spectrometry data for ER proteins and normalizing abundance to the mean abundance of the ER proteome. When data were processed this way, 10 tail-anchored proteins were significantly depleted and 6 were significantly enriched (compared to 203 depleted and 156 enriched for the ER overall). (B) Overexpression of SAE1 rescues the effects of SAE1 knockdown. HeLa cells expressing sgRNA-resistant SAE1 and sgRNA against endogenous SAE1 (‘SAE1 rescue’) were compared to the SAE1 knockdown cells from (A). Proteins that were significantly depleted upon SAE1 knockdown vs. nontargeting control are generally enriched upon SAE1 vs. nfBFP overexpression, and vice versa. (C) Percentage of various protein classes whose abundance positively correlates with that of SAE1. TA: ER tail-anchored proteins; SA: ER signal-anchored proteins; ERM: other ER transmembrane proteins; other: all other ER proteins. ***p<0.001, chi-square test against ‘other‘ ER proteins. Note that compared to the mitochondria a significant number of ER transmembrane proteins are oriented into the lumen, with minimal cytosolic exposure. These proteins may be more insulated from the effects of reduced SUMOylation compared to cytosol-oriented transmembrane or peripheral proteins. (D) Representative traces of protein abundance in basal (left), SAE1 knockdown (middle), or SAE1 rescue (right) conditions. Data shown for three ER tail-anchored, two ER signal-anchored, two ER transmembrane, and two ER lumen proteins. (E) Same as (D), but for the tail-anchored ER protein SQS and the 10 members of the ER membrane complex (EMC). Related to Figure 6. p<0.10, **p<0.01, ***p<0.001, moderated t-test.