. 2021 Aug 20;10:e69142. doi: 10.7554/eLife.69142

Figure 6. EMC10 has opposite regulatory effect on ER tail-anchored (TA) proteins as other ER membrane complex (EMC) subunits.

(A) Locations of 9 of 10 EMC components in the 3-CRISPRi screen CasTLE plot from Figure 3A. EMC5 was not included in the screen. In the table at right, corresponding effect sizes from each screen are shown. (B) Quantitation of the effect of individual EMC subunit (4, 8, and 10) knockdown in the TA, signal-anchored (SA), and ER HiLITR cell lines. Fluorescence-activated cell sorting (FACS) data shown in Figure 6—figure supplement 1. (C) Knockdown of EMC10 increases, while knockdown of EMC4 or EMC8 decreases, the mislocalization of GFP-tagged mTA* protease from mitochondria to Golgi in HeLa cells. Golgi and mitochondria are detected with anti-GRASP65 and anti-TOMM20 antibodies. Scale bar, 10 µm. (D) Quantification of data in (C) along with ~20 additional fields of view per condition (~50 cells per sample). *p<0.05, **p<0.01, ***p<0.001, Student’s t-test. Full data in Figure 6—source data 1. (E) Knockdown of EMC subunits has different effects on endogenous EMC client protein SQS. HeLa cells expressing the indicated sgRNAs (EMC10 sgRNA #2) for 9 days were analyzed by western blot to detect the endogenous TA EMC client protein SQS as well as two non-client proteins (ER lumen protein CALR and ER TA protein VTI1B). Uncropped blots in Figure 6—figure supplement 2. (F) Quantification of data in (E) along with two additional biological replicates per condition. Error bars = SEM. **p<0.01, ***p<0.001, Student’s t-test. Full data in Figure 6—source data 2.

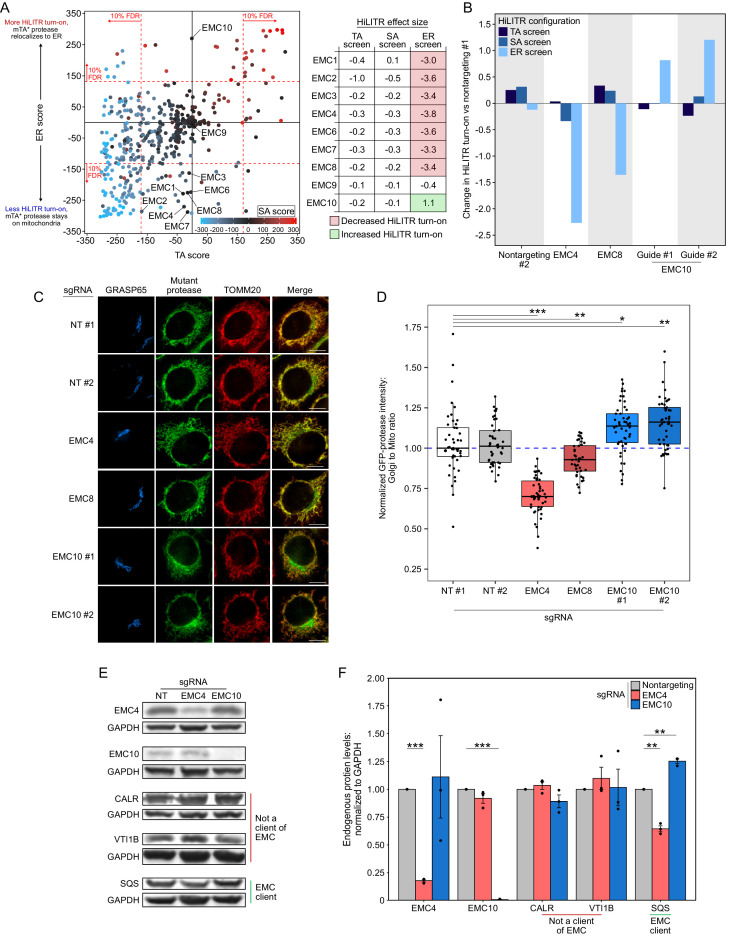
Figure 6—source data 1. Source data for Figure 6D.
Figure 6—source data 2. Source data for Figure 6F.

Figure 6.

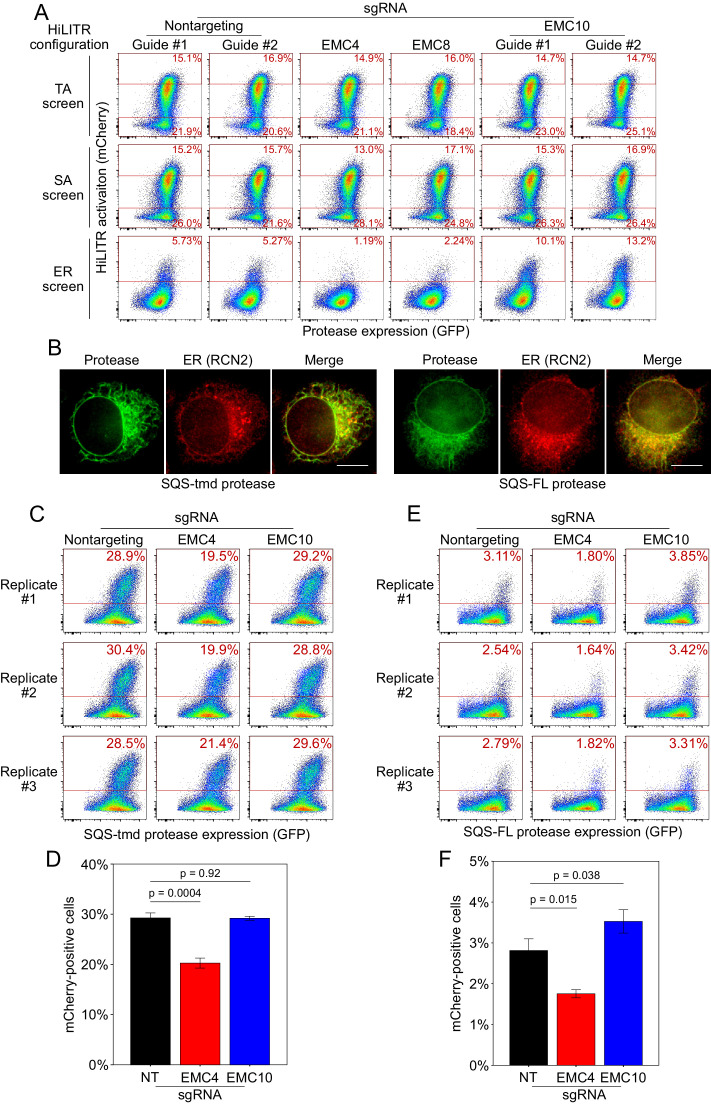
Figure 6—figure supplement 1. Additional HiLITR analysis related to the ER membrane complex (EMC).

Figure 6—figure supplement 1.

(A) Fluorescence-activated cell sorting (FACS) analysis related to Figure 6B. Three HiLITR configurations (as in Figure 2C–E) in K562 cells with sgRNAs against EMC subunits and two nontargeting control guides. (B) Immunofluorescence microscopy of the EMC client tail-anchored proteases. In HeLa cells, the localization of the SQS-tmd and SQS-FL proteases (GFP) was compared to an ER marker (RCN2). Scale bar, 10 µm. (C) FACS analysis of HiLITR for ER-targeted tail-anchored (TA) protease. Protease was targeted to the ER with the transmembrane domain of TA protein SQS. HiLITR transcription factor (TF) was also targeted to the ER. Three biological replicates were performed in polyclonal cell lines, and the percentage of cells above the red line is shown in each plot. (D) Quantitation of the replicates in (C). Error bars = SEM. Significance calculated by Student’s t-test. (E) Same as (C), but the protease was targeted to the ER with full-length SQS. (F) Quantitation of the replicates in (E). Error bars = SEM. Significance calculated by Student’s t-test.
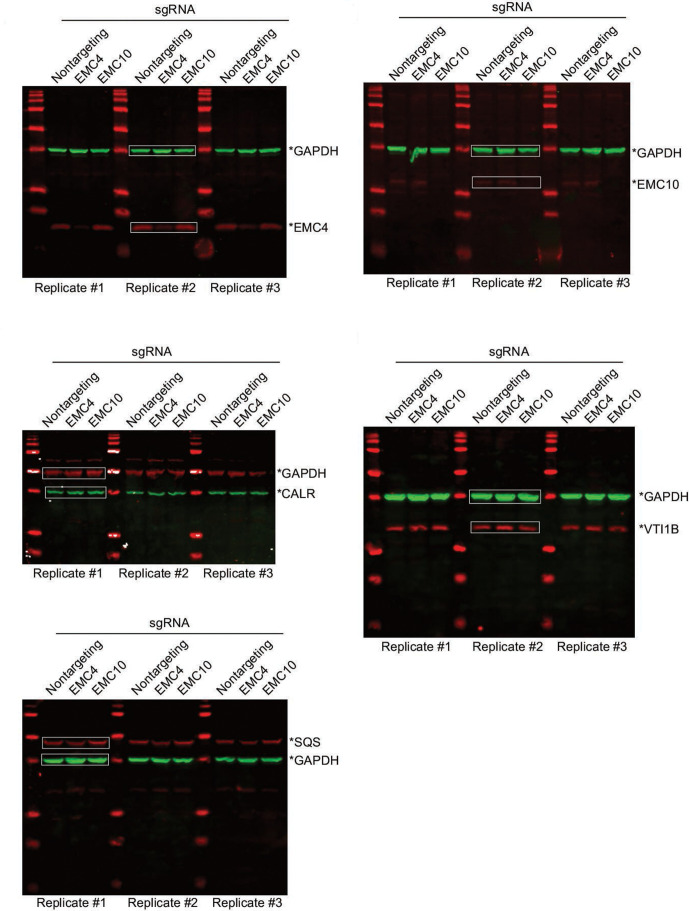
Figure 6—figure supplement 2. Uncropped western blots used to make Figure 6E and F.

Figure 6—figure supplement 2.

Images in Figure 6E were generated from the boxed regions in each plot, which are in each case the replicate most representative of the average shown in Figure 6F.