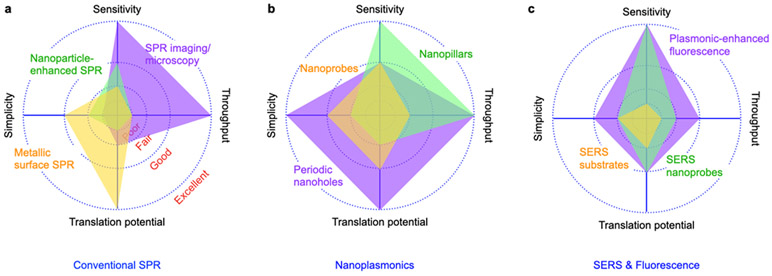
Figure 1. Comparison of SPR platforms.
a Conventional SPR. b Nanoplasmonics. c SERS and PEF. System performances are based on demonstrated platforms for EV detection, as summarized in Table 1. Definition of sensitivity indicator: Poor (>106), Fair (~106), Good (~103), Excellent (single exosome). Definition of throughput (demonstrated multiplexing capability) indicator: Poor (single), Fair (~10), Good (~100), Excellent (>1000 arrays). Simplicity is rated qualitatively based on the complexities in the detection system and chip fabrication. Translational potential is rated qualitatively based on demonstrated clinical validation and results with clinical samples.

