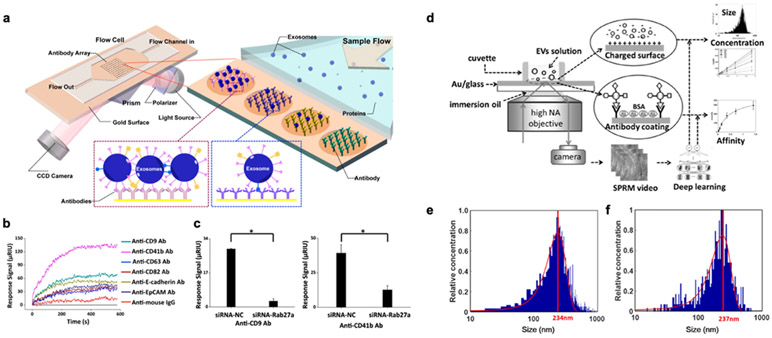
Figure 4. SPR imaging and microscopy.
a SPR imaging in combination with antibody microarray to capture and detect exosomes. b SPRi sensorgrams showing binding of exosomes to various antibodies. c Exosome secretion was suppressed by siRNA-Rab27a (siRNA-NC as a negative control). Reprinted with permission from ref. 66. Copyright 2014 American Chemical Society. d EVs detection with SPR microscopy with a high NA objective. A deep learning algorithm was developed for automatic SPRM image analysis. e-f Size measurement of EVs with SPRM (e) and nanoparticle tracking analysis (f). Mean values were located at 234 and 237 nm, respectively. Reprinted with permission from ref. 31. Copyright 2020 American Chemical Society.

