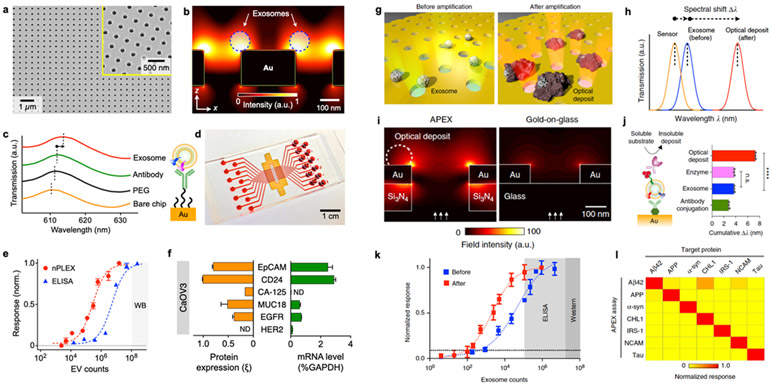
Figure 5. Nanoplasmonics using periodic nanoholes.
a A scanning electron micrograph of the periodic nanoholes in the nPLEX sensor. b Finite-difference time-domain (FDTD) simulation shows the enhanced electromagnetic fields tightly confined near a periodic nanohole surface. c A representative schematic of changes in transmission spectra showing exosome detection with nPLEX, and scanning electron microscopy shows exosome captured by functionalized nPLEX. d Prototype with 12 × 3 detection spots. The nanohole arrays in the shaded area were integrated with microfluidics. e Comparison of the detection sensitivity of nPLEX and ELISA. f mRNA analysis of exosomes eluted from CaOV3 cells. Following nPLEX protein measurements, captured exosomes were released from the chip and subsequently analyzed for mRNA contents. Reprinted with permission from ref. 32. Copyright 2014 Springer Nature. g APEX assay for exosome profiling through an in situ enzymatic amplification. h Schematic of changes in the transmission spectra with APEX amplification. i FDTD simulations with back illumination. j Step-by-step APEX transmission spectral changes. The deposit formation led to ~400% signal enhancement. k Comparison of the detection sensitivities of APEX, ELISA, and western blotting. l specificity of APEX assays for measuring target proteins. Reprinted with permission from ref. 34. Copyright 2019 Springer Nature. Creative Common CC-BY.

