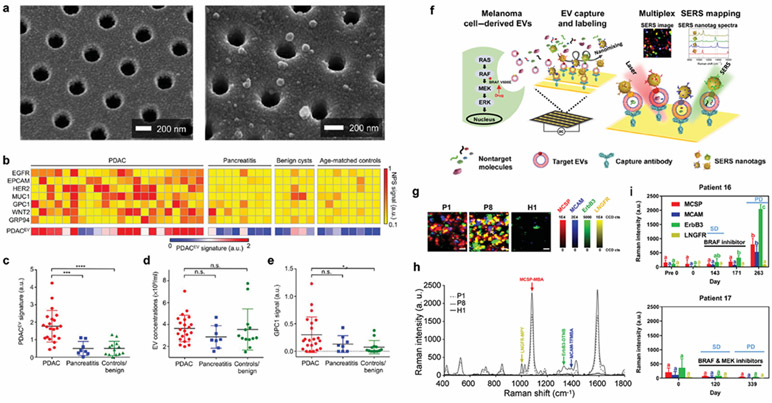
Figure 8. EV molecular profiling for cancer diagnosis.
a Multiparametric plasma EV profiling using periodic nanoholes for the diagnosis of pancreatic malignancy. Scanning electron micrographs show the periodically arranged nanopore array and EVs captured on the surface. b Heatmap analysis of EV markers. The PDACEV signature is defined as a combined marker panel of EGFR, EPCAM, MUC1, GPC1, and WNT2. c The established PDACEV signature signals, d EV concentrations, and e single GPC1 signal as measured for plasma EVs collected from 22 PDAC patients, 8 with pancreatitis, 5 with benign cystic tumors, and 8 age-matched controls. Reprinted with permission from ref. 89. Copyright 2017 American Association for the Advancement of Science. f Tracking extracellular vesicle phenotypes for melanoma monitoring. EVs from melanoma cells are captured, and SERS nanotags are attached. The characterization of EV phenotypes is performed by SERS mapping (MCSP-MBA, red; MCAM-TFMBA, blue; ErbB3-DTNB, green; LNGFR-MPY, yellow). g Representative false-color SERS spectral images and h corresponding average SERS spectra from patient and normal samples. i Monitoring EV phenotypic evolution of patients 16 and 17 during targeted therapies. Patient 16 was treated with dabrafenib. Stable disease (SD) on day 143 and developed progressive disease (PD) after cessation of treatment (day 263) were shown. Patient 17 received the combination treatment of dabrafenib and trametinib. SD on day 120 and PD at the third visit (day 339) were shown. Reprinted with permission from ref. 54. Copyright 2020 The Authors, some rights reserved; exclusive licensee American Association for the Advancement of Science. Distributed under a Creative Commons Attribution NonCommercial License 4.0 (CC BY-NC) http://creativecommons.org/licenses/by-nc/4.0/.

