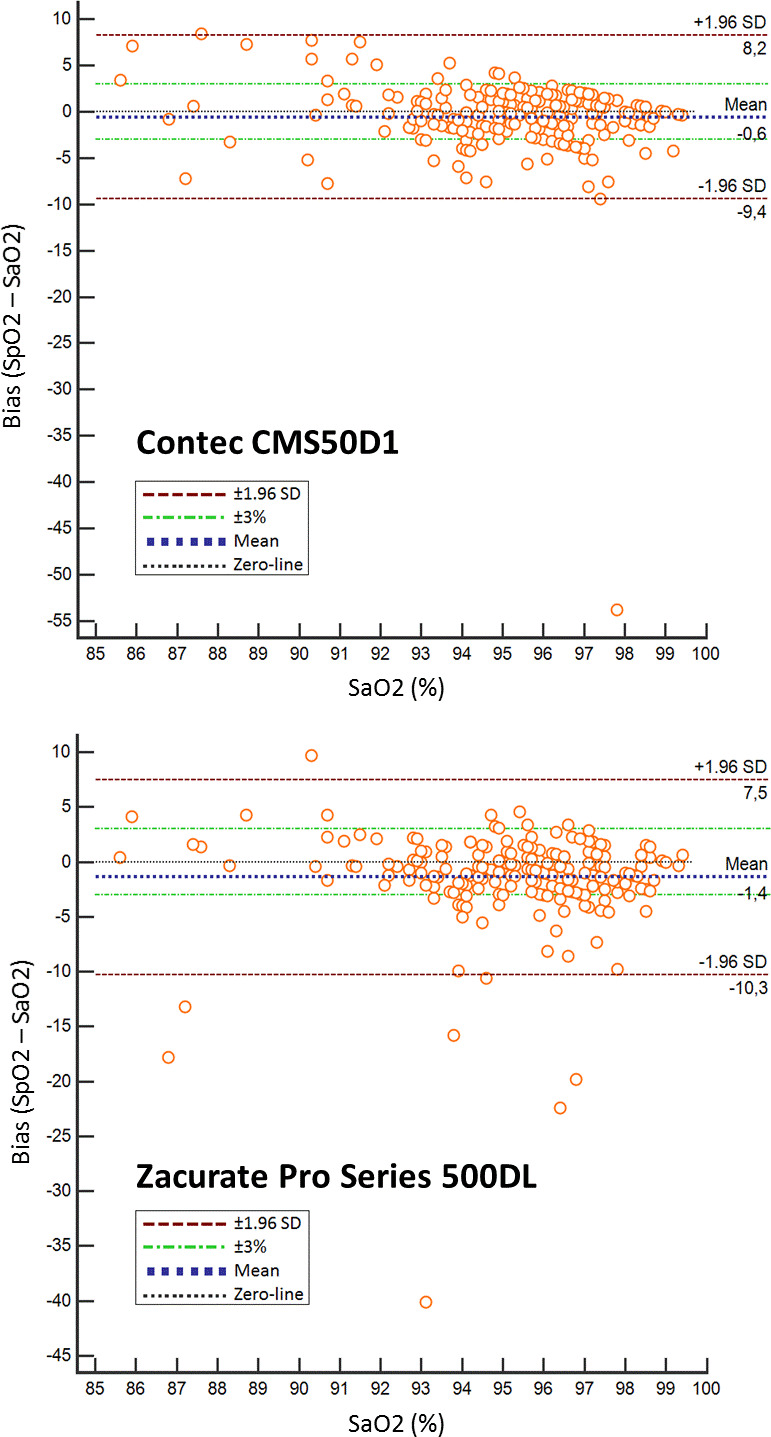
Figure 2.

Bland-Altman plots of the bias compared with SaO2 of two pulse oximeters with the lowest mean bias (Contec CMS50D1 −0.6 and Zacurate Pro series 500 DL −1.4). *Bland-Altman plots for each pulse oximeter to graphically display its bias (SpO2–SaO2) to the reference standard (SaO2). We added a zero-line and upper and lower limits of agreement (±1.96 SD). To visualise the accuracy standards required by the regulatory bodies, ±3% lines are also displayed in the figures. *Bland-Altman plots of the other pulse oximeters can be found as a supplemental figure.
