Figure 8.

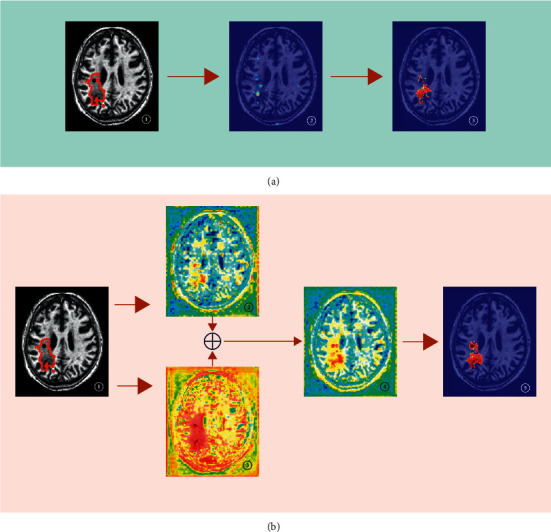
Visualization examples of the attention coefficient maps of different methods: (a) single-path primary network individually; \(b) DPAC-UNet.

Visualization examples of the attention coefficient maps of different methods: (a) single-path primary network individually; \(b) DPAC-UNet.