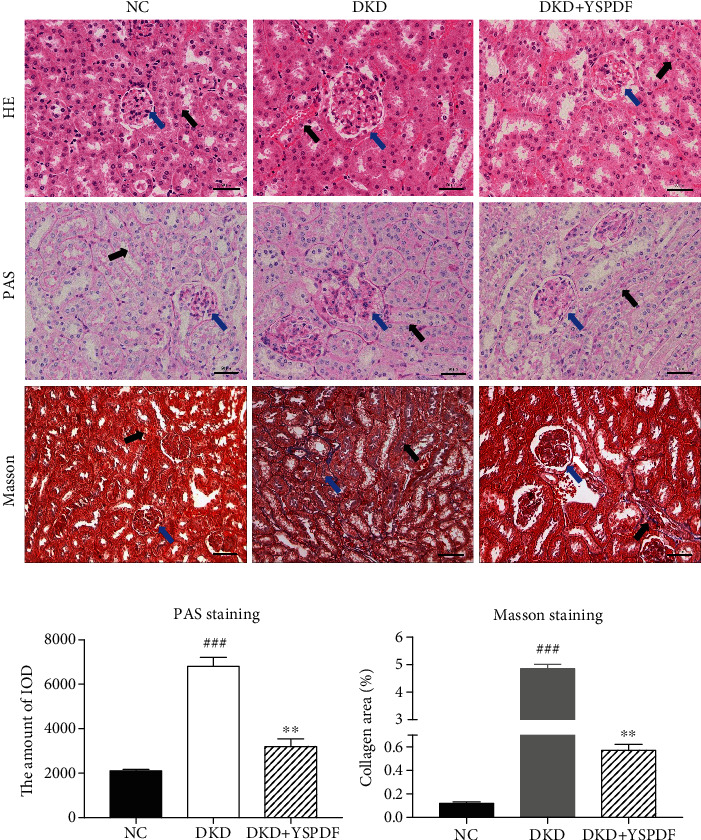
Figure 2.

Effect of YSPDF on histopathological changes of the kidney in db/db mice. (a) Representative images of H&E, PAS, and Masson staining of kidney tissues were shown (400x). Each bar indicates 50 μm. (b) Glomerular injury using PAS staining and tubulointerstitial fibrosis using Masson staining. Blue arrows show the glomeruli, and the black arrows show kidney tubules. Data were presented as the mean ± SEM; n = 3; ###p < 0.001 compared with the normal control group; ∗∗p < 0.01 compared with the DKD group.
