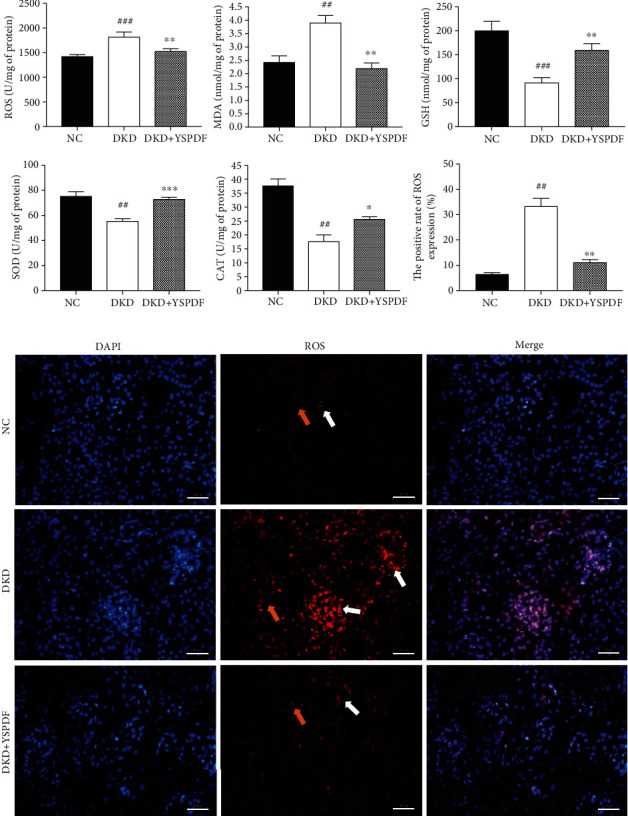
Figure 4.

YSPDF ameliorated oxidative stress in db/db mice. (a) Oxidative stress parameters including ROS, MDA, GSH, SOD, and CAT were determined by commercial assay kits. DHE fluorescence intensity was measured by IPP, and results were expressed by the ratio of fluorescence intensity of the DHE-positive area to the DAPI. (b) ROS level was determined by DHE staining (400x). Each bar indicates 50 μm. White arrows show the glomeruli, and the yellow arrows show kidney tubules. ##p < 0.01 and ###p < 0.001 compared with the normal control group; ∗p < 0.05, ∗∗p < 0.01, and ∗∗∗p < 0.001 compared with the DKD group.
