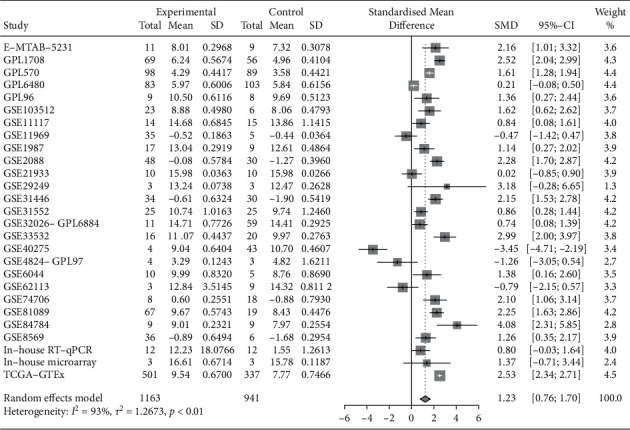
Figure 4.

Integration analysis of ENO1 mRNA expression in LUSC. According to in-house RT-qPCR, in-house microarray, public sequencing data, and microarray, the upregulation of ENO1 expression in LUSC tissues was detected. SMD plot, SMD = 1.23 [0.76–1.70], P < 0.001. Note: SD, standard deviation; SMD, standardized mean difference; LUSC, squamous cell carcinoma of lung.
