Figure 3.

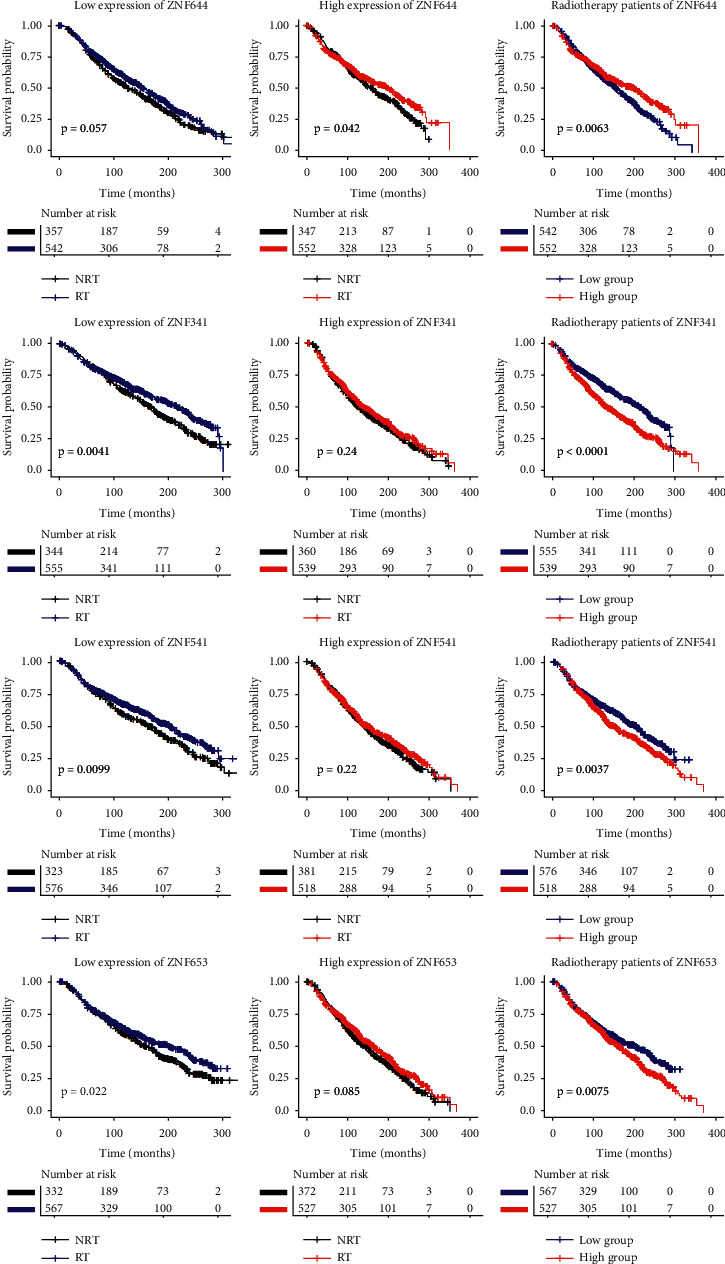
The survival curves comparison of radiotherapy and ZNF gene expression levels in METABRIC data. RT, radiotherapy; NRT, nonradiotherapy.

The survival curves comparison of radiotherapy and ZNF gene expression levels in METABRIC data. RT, radiotherapy; NRT, nonradiotherapy.