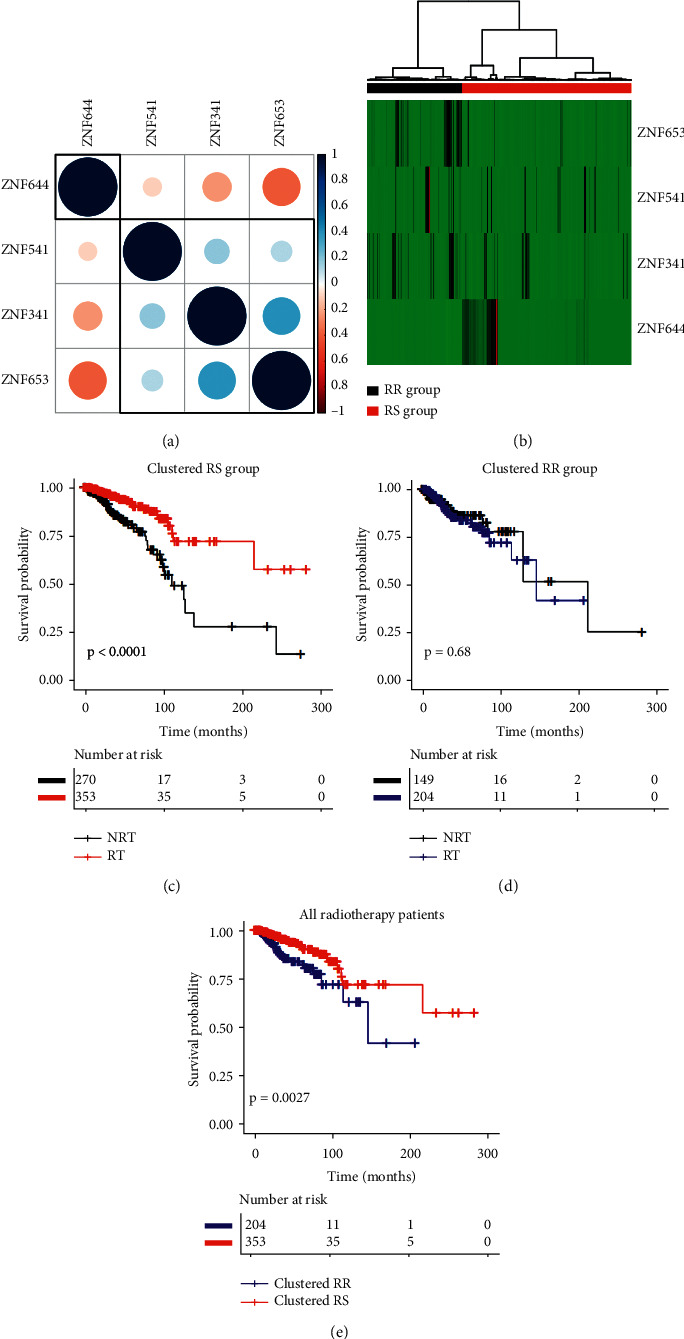
Figure 5.

TCGA data. (a) Correlation plot based on Pearson's correlation test results to show the correlation of gene expression among the 4 ZNF family members. (b) Hierarchical clustering analysis. The top red and black bands denote the clustered radiosensitive (RS) and radioresistant (RR) patients, respectively. (c–e) The survival curves under radiotherapy and nonradiotherapy for both clustered radiosensitive (RS) and radioresistant (RR) patients.
