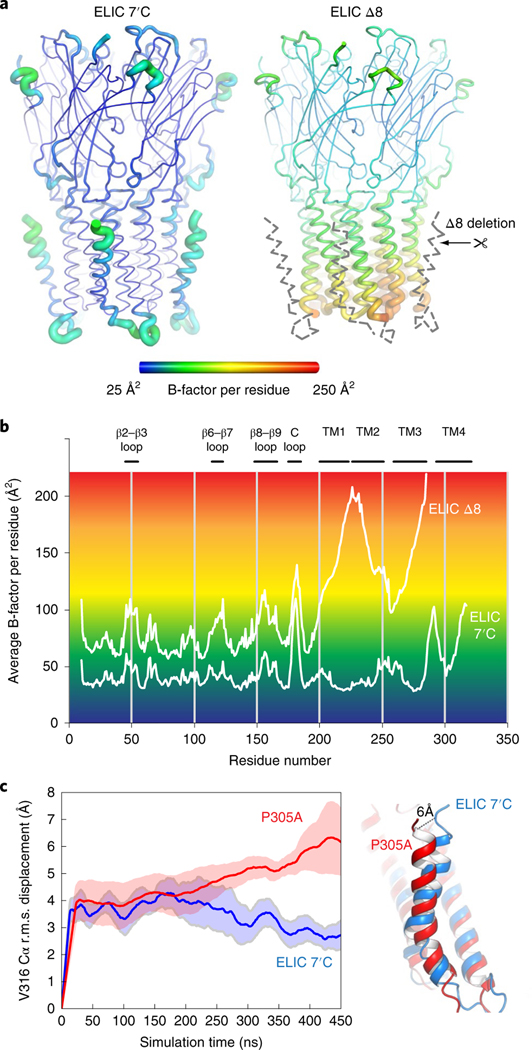
Fig. 4 |. M4-helix truncation increases the dynamics of the lower half of the channel pore region.
a, Cartoon ‘putty’ representation of the ELIC 7′C structure and ELIC Δ8 deletion mutant both in complex with Nb72 (not shown). Residues are colored according to the average temperature B-factor, ranging from 25 Å2 (blue) to 250 Å2 (red) and for intermediate values according to the color shading indicated in the spectrum bar. The M4 helix and M3–M4 linker are structurally flexible in the ELIC Δ8 structure and are indicated with a gray dashed line. b, Plot of the average B-factor per residue as a function of residue number for ELIC 7’C and ELIC Δ8 structures. c, MD simulations of ELIC 7’C (blue) and P305A (red) reveal that the M4 undergoes a conformational change in P305A, which unkinks the helix and causes a conformational tilt toward the complementary subunit. The solid line represents the average of five subunits and the shading represents the s.e.m. The dashed line indicates the distance measured between the Cα of residue V316 in both conformations.

