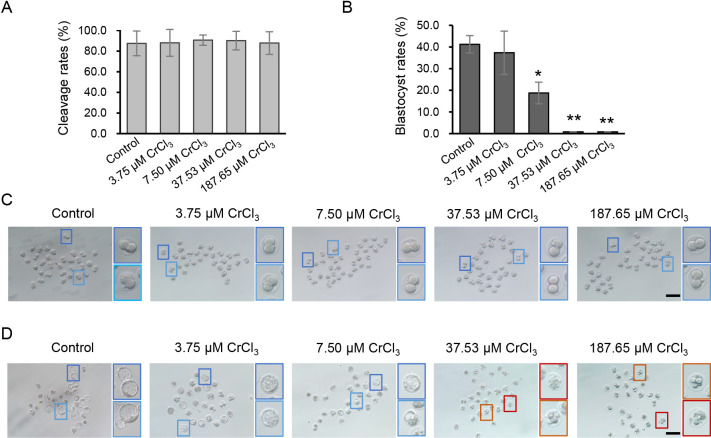
Fig. 2.
Effects of different concentrations of CrCl3 on development rate of preimplantation embryos. (A and B) Cleavage rate (A) and blastocyst development rate (B) of embryos exposed to different concentrations of CrCl3. (C and D) Representative images of cleavage embryos exposed to different concentrations of CrCl3 at E1.5 (C) and E4.0 (D). Higher magnification of light and dark blue box regions indicates well-developing 2-cell embryos or blastocysts in each group. Higher magnification of orange and red box regions indicates embryos arrested at the 4-cell stage or embryos showing a representative fragmentation pattern. * P < 0.05; ** P < 0.01. Three independent experiments were performed.

