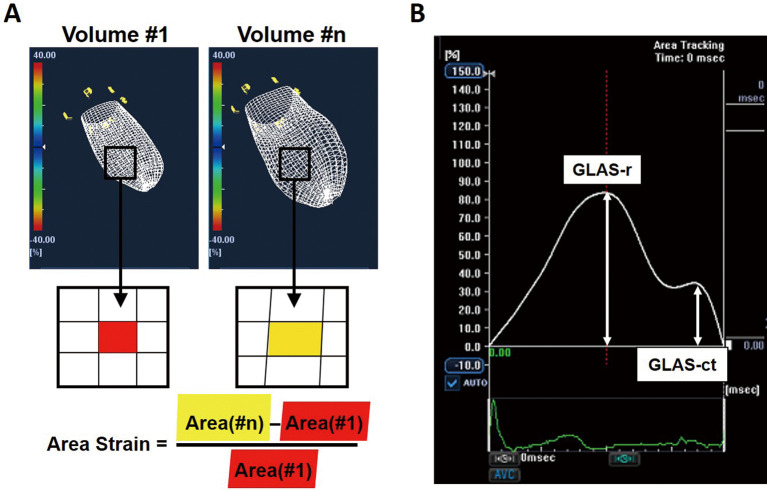
Figure 2.
(A) Left atrial (LA) endocardial surfaces shown in 3 dimensions with a mesh pattern. Initial volume, #1 (Left panel); volume at time, #n (Right panel). The image shows unit segments of the endocardium at Volume #1 (red quadrangular area) and at Volume #n; the red area in Volume #1 corresponds to the yellow area in Volume #n. The area strain of the LA endocardial surface from Volume #1 to Volume #n is given by the equation shown at the bottom. (B) Both global left atrial area strain (GLAS) during the reservoir phase (GLAS-r) and during the contraction phase (GLAS-ct) were determined from the temporal change in the GLAS profile.

