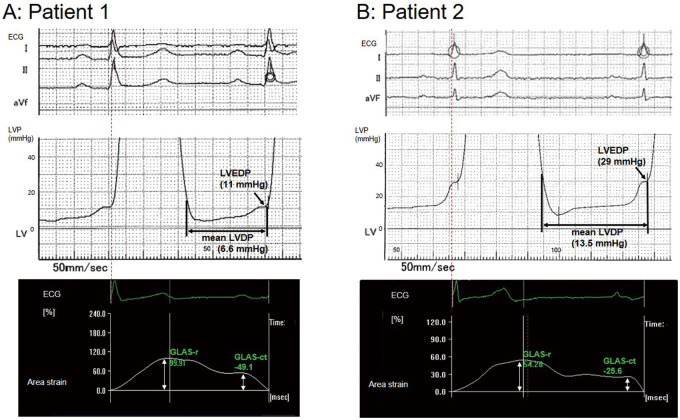
Figure 3.
Left ventricular (LV) pressure (LVP) waveforms focusing on diastolic pressure including electrocardiography (ECG; Top) and temporal profiles of global left atrial area strain (GLAS) during a cardiac cycle (Bottom). (A) Patient 1 was a 65-year-old female with angina pectoris on exertion and preserved left ventricular ejection fraction (LVEF; 76.7%). The analyzed values of GLAS during the reservoir phase (GLAS-r) and the contraction phase (GLAS-ct) were 99.9% and –45.1%, respectively (Bottom). Subsequent catheterization determined that the mean LV diastolic pressure (mLVDP) and LV end-diastolic pressure (LVEDP) were 6.6 and 11 mmHg, respectively (Top). (B) Patient 2 was a 72-year-old male with angina pectoris on exertion and preserved LVEF (70.5%). The analyzed values of GLAS-r and GLAS-ct were 54.3% and –25.6%, respectively (Bottom), and thus the mLVDP and LVEDP were estimated to be elevated using our cut-off values. Subsequent catheterization determined that the mLVDP and LVEDP were 13.5 and 29 mmHg, respectively (Top).

