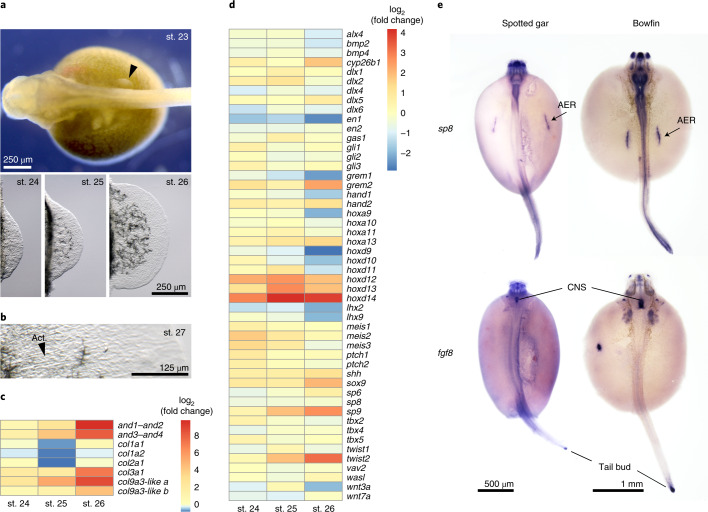
Fig. 6. Gene expression analyses of developing pectoral fins in bowfin.
a, Bowfin developmental stages53 used for RNA-seq transcriptome analysis. The fin bud is first visible at stage 23 (black arrowhead, anterior to left). Isolated fin buds showing increasing size from stages 24 to 25 to 26 (anterior to top, distal to right). b, Actinotrichia (Act.) fibrils first appear at stage 27. Pictures in a,b are representative of n = 5 individuals per stage. c, Transcriptional log2 (fold change) in fin fold structural genes relative to that at stage 23. Between stages 23 and 26, and1–and2 and and3–and4 show 862- and 285-fold increases, respectively; col3a1, col9a3-like a and col9a3-like b exhibit 133-, 417- and 19-fold increases. Stable expression across stages is observed for col1a1, col1a2 and col2a1, each showing a fold-change range between 0.5 and 1.6. d, Transcriptional log2 (fold change) in expression of fin or limb patterning genes relative to that of stage 23 fin buds. Indicative of their temporal collinearity, expression of hoxa9, hoxa10, hoxd9 and hoxd10 peaks at stage 23, while expression of the more posterior hoxa11, hoxa13, hoxd11, hoxd12 and hoxd13 peaks at stage 25. Expression of hoxa13 is highest at stage 26. The highest expression level of hoxd14 is at stages 25 and 26. e, The transcription factor gene sp8 is expressed in the AER of gar (stage 26) and bowfin (stage 23), while fgf8 expression is not detected in the AER of either holostean (n = 10 samples per gene and species). CNS, central nervous system.

