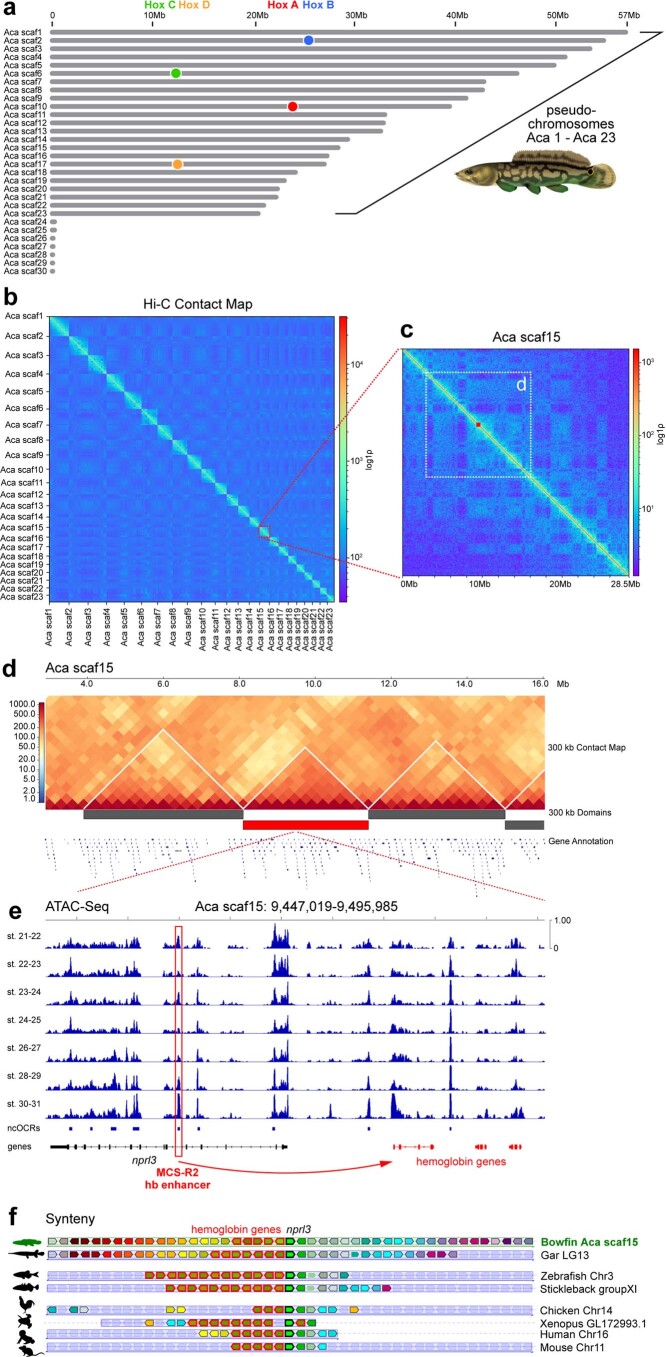
Extended Data Fig. 1. The bowfin genome.
(a) Size distribution of the 30 largest scaffolds in the AmiCal1 assembly. Aca scaf1 to Aca scaf23 match the number of chromosomes in the bowfin genome21,29 and are thus considered pseudochromosomes. Locations of the four bowfin Hox gene clusters Hox A-D are indicated by colored circles. (b) Hi-C contact map for the 23 pseudochromosomes, generated from blood sample. Resolution: 500-kb bins. The red dashed box indicates Aca scaf15. (c) Hi-C contact map for Aca scaf15. Resolution: 50-kb bins. (d) Topologically Associating Domains (TADs) called using a resolution of 300-kb bin size in the region of Aca scaf15 indicated by the white dashed box in (c). (e) ATAC-Seq profile through bowfin development within the central TAD in (d). ATAC-Seq peaks and ncOCRs are observed for a putative bowfin ortholog of the MCS-R2 hb enhancer in intron 5 of the nprl3 gene known to regulate flanking hemoglobin genes62 (red). (f) Conserved synteny of the region containing hemoglobin genes (red highlighted arrows) on bowfin Aca scaf15 to gar, teleosts, and tetrapods, centered on the nprl3 gene (central green arrow) that contains the putative MCS-R2 intronic hb enhancer.

