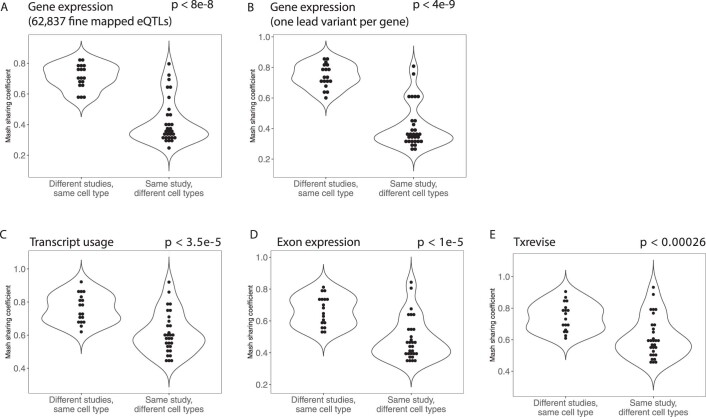
Extended Data Fig. 5. Quantifying QTL sharing between tissues, cell types and studies.
Distribution of pairwise mash QTL sharing estimates for seven cell types and tissues (skin, adipose, LCL, blood, fibroblast, muscle, brain (DLPFC)) profiled in two or more studies (GTEx, TwinsUK, GENCORD, GEUVADIS, Lepik_2017, ROSMAP, FUSION). Each panel contrasts the QTL sharing estimates for the same cell type or tissue profiled in different studies (n = 18) against different cell types and tissues profiled in the same study (n = 30). Analysis was performed separately for gene expression (a-b), transcript usage (c), exon expression (d) and txrevise (e) QTLs. Note that adipose, skin and muscle tissues have high eQTL sharing also within the same study. The p-values were calculated using the two-sample Wilcoxon rank sum test (two-sided).

