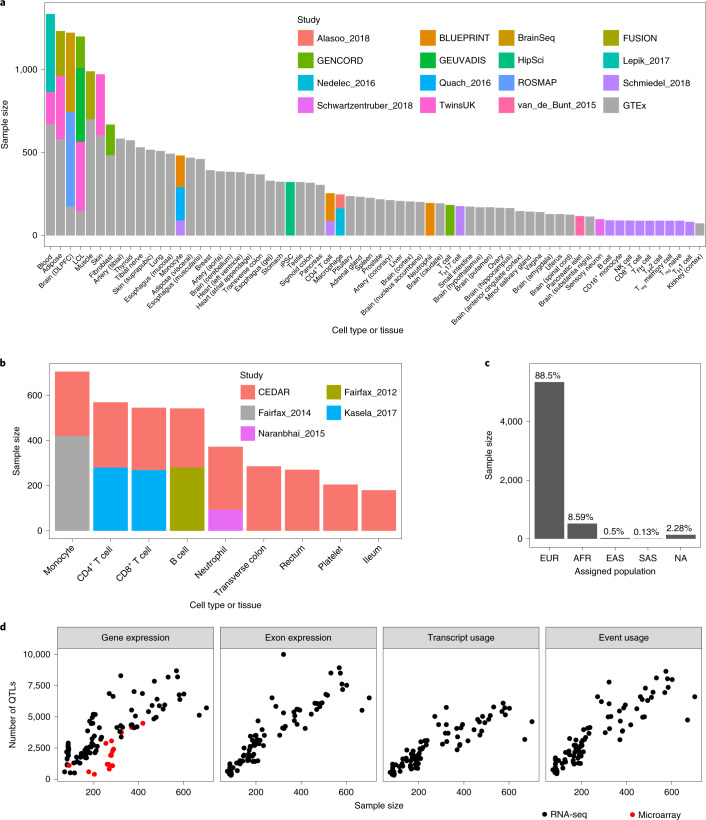
Fig. 2. Overview of studies and samples included in the eQTL Catalogue.
a, Cumulative RNA-seq sample size for each cell type and tissue across 16 studies. Datasets from stimulated conditions have been excluded to improve readability. DLPFC, dorsolateral prefrontal cortex; NK cell, natural killer cell; TFH cell, follicular helper T cell; TH cell, helper T cell; Treg, regulatory T cell. b, The cumulative microarray sample size for each cell type and tissue across five studies. Datasets from stimulated conditions have been excluded to improve readability. c, The number of unique donors assigned to the four major superpopulations in the 1000 Genomes phase 3 reference dataset. Detailed assignment of donors to the four superpopulations in each study is presented in Supplementary Table 1. Superpopulation codes: EUR, Europe; AFR, Africa; EAS, east Asia; SAS, south Asia; NA, unassigned. d, The relationship between the sample size of each dataset and the number of associations detected with each quantification method. The number of QTLs on the y axis is defined as the number of genes with at least one significant QTL (FDR < 0.05).

