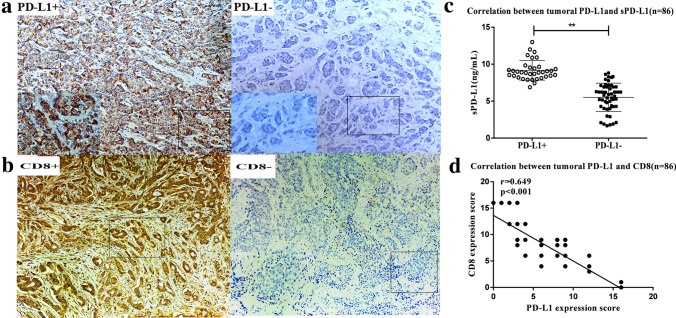
Fig. 5.
Immunohistochemical staining of tumoral PD-L1 expression and correlation with corresponding plasma sPD-L1 level. a Immunohistochemical staining of PD-L1 expression in advanced breast cancer (10 × HPF and 40 × HPF), PD-L1 staining in ≥ 1% of tumor cells or in stroma cells(left), PD-L1 staining in < 1% of tumor cells (right). b Immunohistochemical staining of CD8 expression in advanced breast cancer (10 × HPF and 40 × HPF), PD-L1 staining in ≥ 1% of tumor cells or in stroma cells(left), PD-L1 staining in < 1% of tumor cells (right). c Correlation between tumoral PD-L1 expression and corresponding plasma sPD-L1 level (n = 86). Statistical analysis was performed using the Mann–Whitney U test. **, p < 0.01. d A statistically significant inverse correlation between tumoral PD-L1 and CD8 expression score in 86 cases of breast cancer tissues

