Fig. 1.
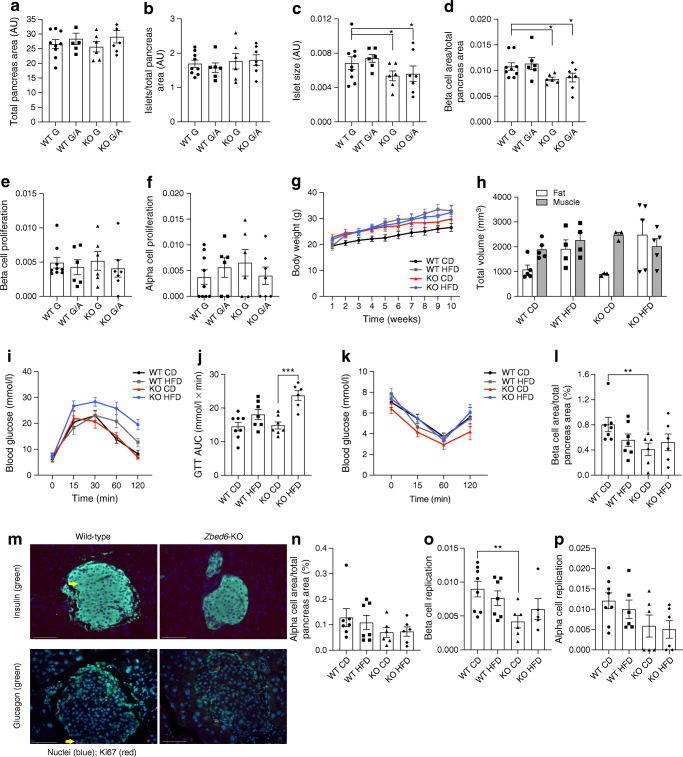
Islet size and beta cell area are reduced in Zbed6 KO G and Zbed6 KO G/A mice and Zbed6 KO promotes HFD-induced glucose intolerance. WT G, KO G, WT G/A and KO G/A mice were killed when 25–28 weeks of age and analysed for (a) total pancreas area, (b) islet number, (c) islet size, (d) beta cell area, (e) beta cell proliferation and (f) alpha cell proliferation. Results are means ± SEM for 6–9 mice per group. *p < 0.05 vs corresponding WT mice. (g) Weight curve of WT G and KO G mice given a CD or an HFD from 6 to 15 weeks of age; 7–8 mice per group were analysed. (h) Micro-CT was performed on the mice shortly after euthanasia and fat and muscle mass was quantified; 3–5 mice per group were analysed. (i) GTT of WT G and KO G mice treated with HFD or CD. Mice were fasted for 8 h and injected intraperitoneally with glucose (2.5 g/kg). Blood glucose levels were analysed at the time points given. Results are means ± SEM for 6–8 mice in each group. (j) Data from (i) were recalculated to AUC. *** p < 0.001 vs KO mice given a CD. (k) Insulin sensitivity test of WT G and KO G mice treated for 9 weeks with an HFD. Insulin (1.6 U/kg Actrapid) was injected i.p. and blood glucose was analysed at the time points given in the figure. Results are means ± SEM for 6–8 mice in each group. (l) Beta cell area was assessed by morphometric analysis. ** p < 0.01 vs WT CD (n; = 6–8 mice). (m) Representative immunostainings showing morphology of beta cells (insulin, green), alpha cells (glucagon, green) and Ki-67 positive cells (red). Arrows point to two Ki-67 positive beta/alpha cells. White scale bars, 100 μm. (n) Alpha cell area was assessed by morphometric analysis (n = 6–8 mice). Beta cell (o) and alpha cell (p) replication was assessed by Ki-67 immunostaining. ** p < 0.01 vs WT CD mice (n = 6–8 mice)

