Fig. 4.
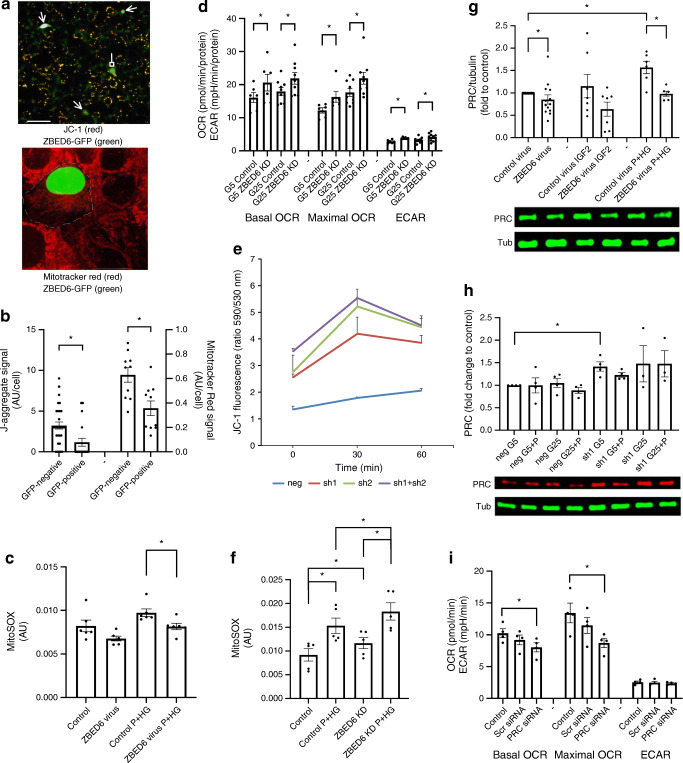
ZBED6 overexpression in EndoC-βH1 cells results in lowered J-aggregate fluorescence, MitoTracker Red uptake and mitochondrial ROS production. Downregulation of ZBED6 results in increased OCR, ECAR, J-aggregate fluorescence and mitochondrial ROS production. ZBED6 overexpression reduces expression level of PRC, and ZBED6 downregulation increases expression level of PRC. (a) A fluorescence microscopic image with JC-1 staining (3 μmol/l for 10 min, red colour) of EndoC-βH1 cells showing three ZBED6-GFP-positive cells (green colour, arrows) with no active mitochondria, one ZBED6-GFP-positive cell with active mitochondria (green, block head). Scale bar, 10 μm. Confocal image showing MitoTracker Red staining (10 μmol/l for 10 min, red colour) of a ZBED6-GFP expressing cell (green nucleus) surrounded by non-transfected cells. The dotted line shows the probable cell membrane position of the ZBED6-GFP-positive cell. Scale bar, 50 μm. (b) Left axis: quantification of J-aggregate positive mitochondrial structures in GFP-positive and GFP-negative cells. Results are means from 21 (GFP-negative) and 29 (GFP-positive) cells obtained from six randomly photographed culture plate areas. Right axis: quantification of Mitotracker Red signal in GFP-positive and GFP-negative cells. Results are means from ten randomly photographed GFP-positive cells with an adjacent GFP-negative cell. (c) MitoSOX fluorescence in EndoC-βH1 control and ZBED6 overexpressing cells quantified by flow cytometry. Cells were cultured for 24 h at standard conditions (5 mmol/l glucose, control) or supplemented with 0.5 mmol/l palmitate + 20 mmol/l glucose (P+HG), and then labelled for 40 min with 1 μmol/l of the MitoSOX probe. Results are means ± SEM for six independent experiments. *p < 0.05. (d) Control and Zbed6 knockdown (ZBED6 KD) MIN6 cells were cultured for 24 h in 5 mmol/l (G5) or 25 mmol/l (G25) glucose and then pre-incubated at 5.6 mmol/l glucose for 1 h prior to measuring mitochondrial respiration at 5 mmol/l (G5) or 25 mmol/l (G25) glucose using the Seahorse technique. Basal OCR, maximal OCR (after FCCP addition) and ECAR were calculated. Results are from six independent experiments. *p < 0.05 vs corresponding control cells. (e) βTC-6 cells treated with scrambled shRNA lentiviral particles (negative control; neg) or with two different anti-Zbed6 shRNA lentiviral particles (sh1 and sh2) were labelled with 3 μmol/l JC-1 for 10 min and then treated with 0.5 mmol/l palmitate +25 mmol/l glucose (P+HG) for 0, 30 or 60 min. J-aggregate fluorescence was obtained by flow cytometry analysis and by calculation of the FL2/FL1 (590/530 nm) ratio. Results are means ± SEM for three experiments. (f) MitoSOX fluorescence in MIN6 control and ZBED6 KD cells quantified by flow cytometry. Cells were cultured for 24 h under standard conditions (25 mmol/l glucose, control) or supplemented with 0.5 mmol/l palmitate + 25 mmol/l glucose (P+HG), and then labelled for 40 min at 1 μmol/l MitoSOX probe. Results are means ± SEM for five independent experiments. *p < 0.05. (g−i) ZBED6 overexpression reduces and ZBED6 downregulation increases expression level of PRC. (g) Control and ZBED6 overexpressing EndoC-βH1 cells were cultured for 48 h and then treated with or without mouse IGF2 (100 ng/ml) or the combination palmitate (1.5 mmol/l in 2% BSA) and high glucose (20 mmol/l) for 3 h. The expression level of PRC was measured by immunoblotting analysis. Results are normalised to α-tubulin (Tub) expression level and are expressed as means ± SEM for 6–13 independent experiments. *p < 0.05. (h) MIN6 cells expressing scramble shRNA (neg) or anti-Zbed6 shRNA (sh1) were analysed for PRC expression using immunoblot analysis. Cells were cultured for 24 h in the presence of 5 mmol/l glucose (G5), 5 mmol/l glucose + 0.5 mmol/l palmitate (G5+P), 25 mmol/l glucose (G25) or 25 mmol/l glucose + 0.5 mmol/l palmitate (G25+P). Results are from 3–4 independent experiments. (i) Knockdown of PRC results in reduced basal and maximal OCR. EndoC-βH1 cells were transfected with 50 nmol/l siRNA targeting to PRC and then were analysed for OCR using the Seahorse technique. Results are from four independent experiments. *p < 0.05 vs control

