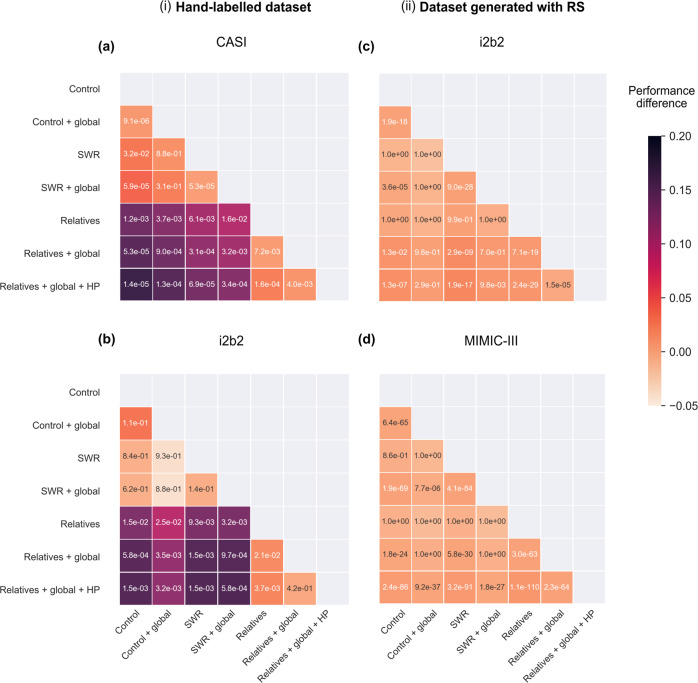
Fig. 2. Matrix showing performance differences and p-values between all models on test sets generated by (i) hand-labeling and (ii) RS.
The external test sets are a CASI, b i2b2 generated by hand labeling, c i2b2 generated by RS, and d MIMIC-III generated by RS. The color intensity of each square reflects the performance difference between the corresponding model on the vertical axis and the model on the horizontal axis. p-Values were obtained using a one-sided Wilcoxon signed-rank test and are displayed inside each square. Note that we expect (and observe) no improvement from introducing relatives in the MIMIC-III dataset (d), as the default (control) algorithm better represents the underlying data distribution in MIMIC-III.

